Descriptive stats: RBI
🕐 Greatest impact on business days…
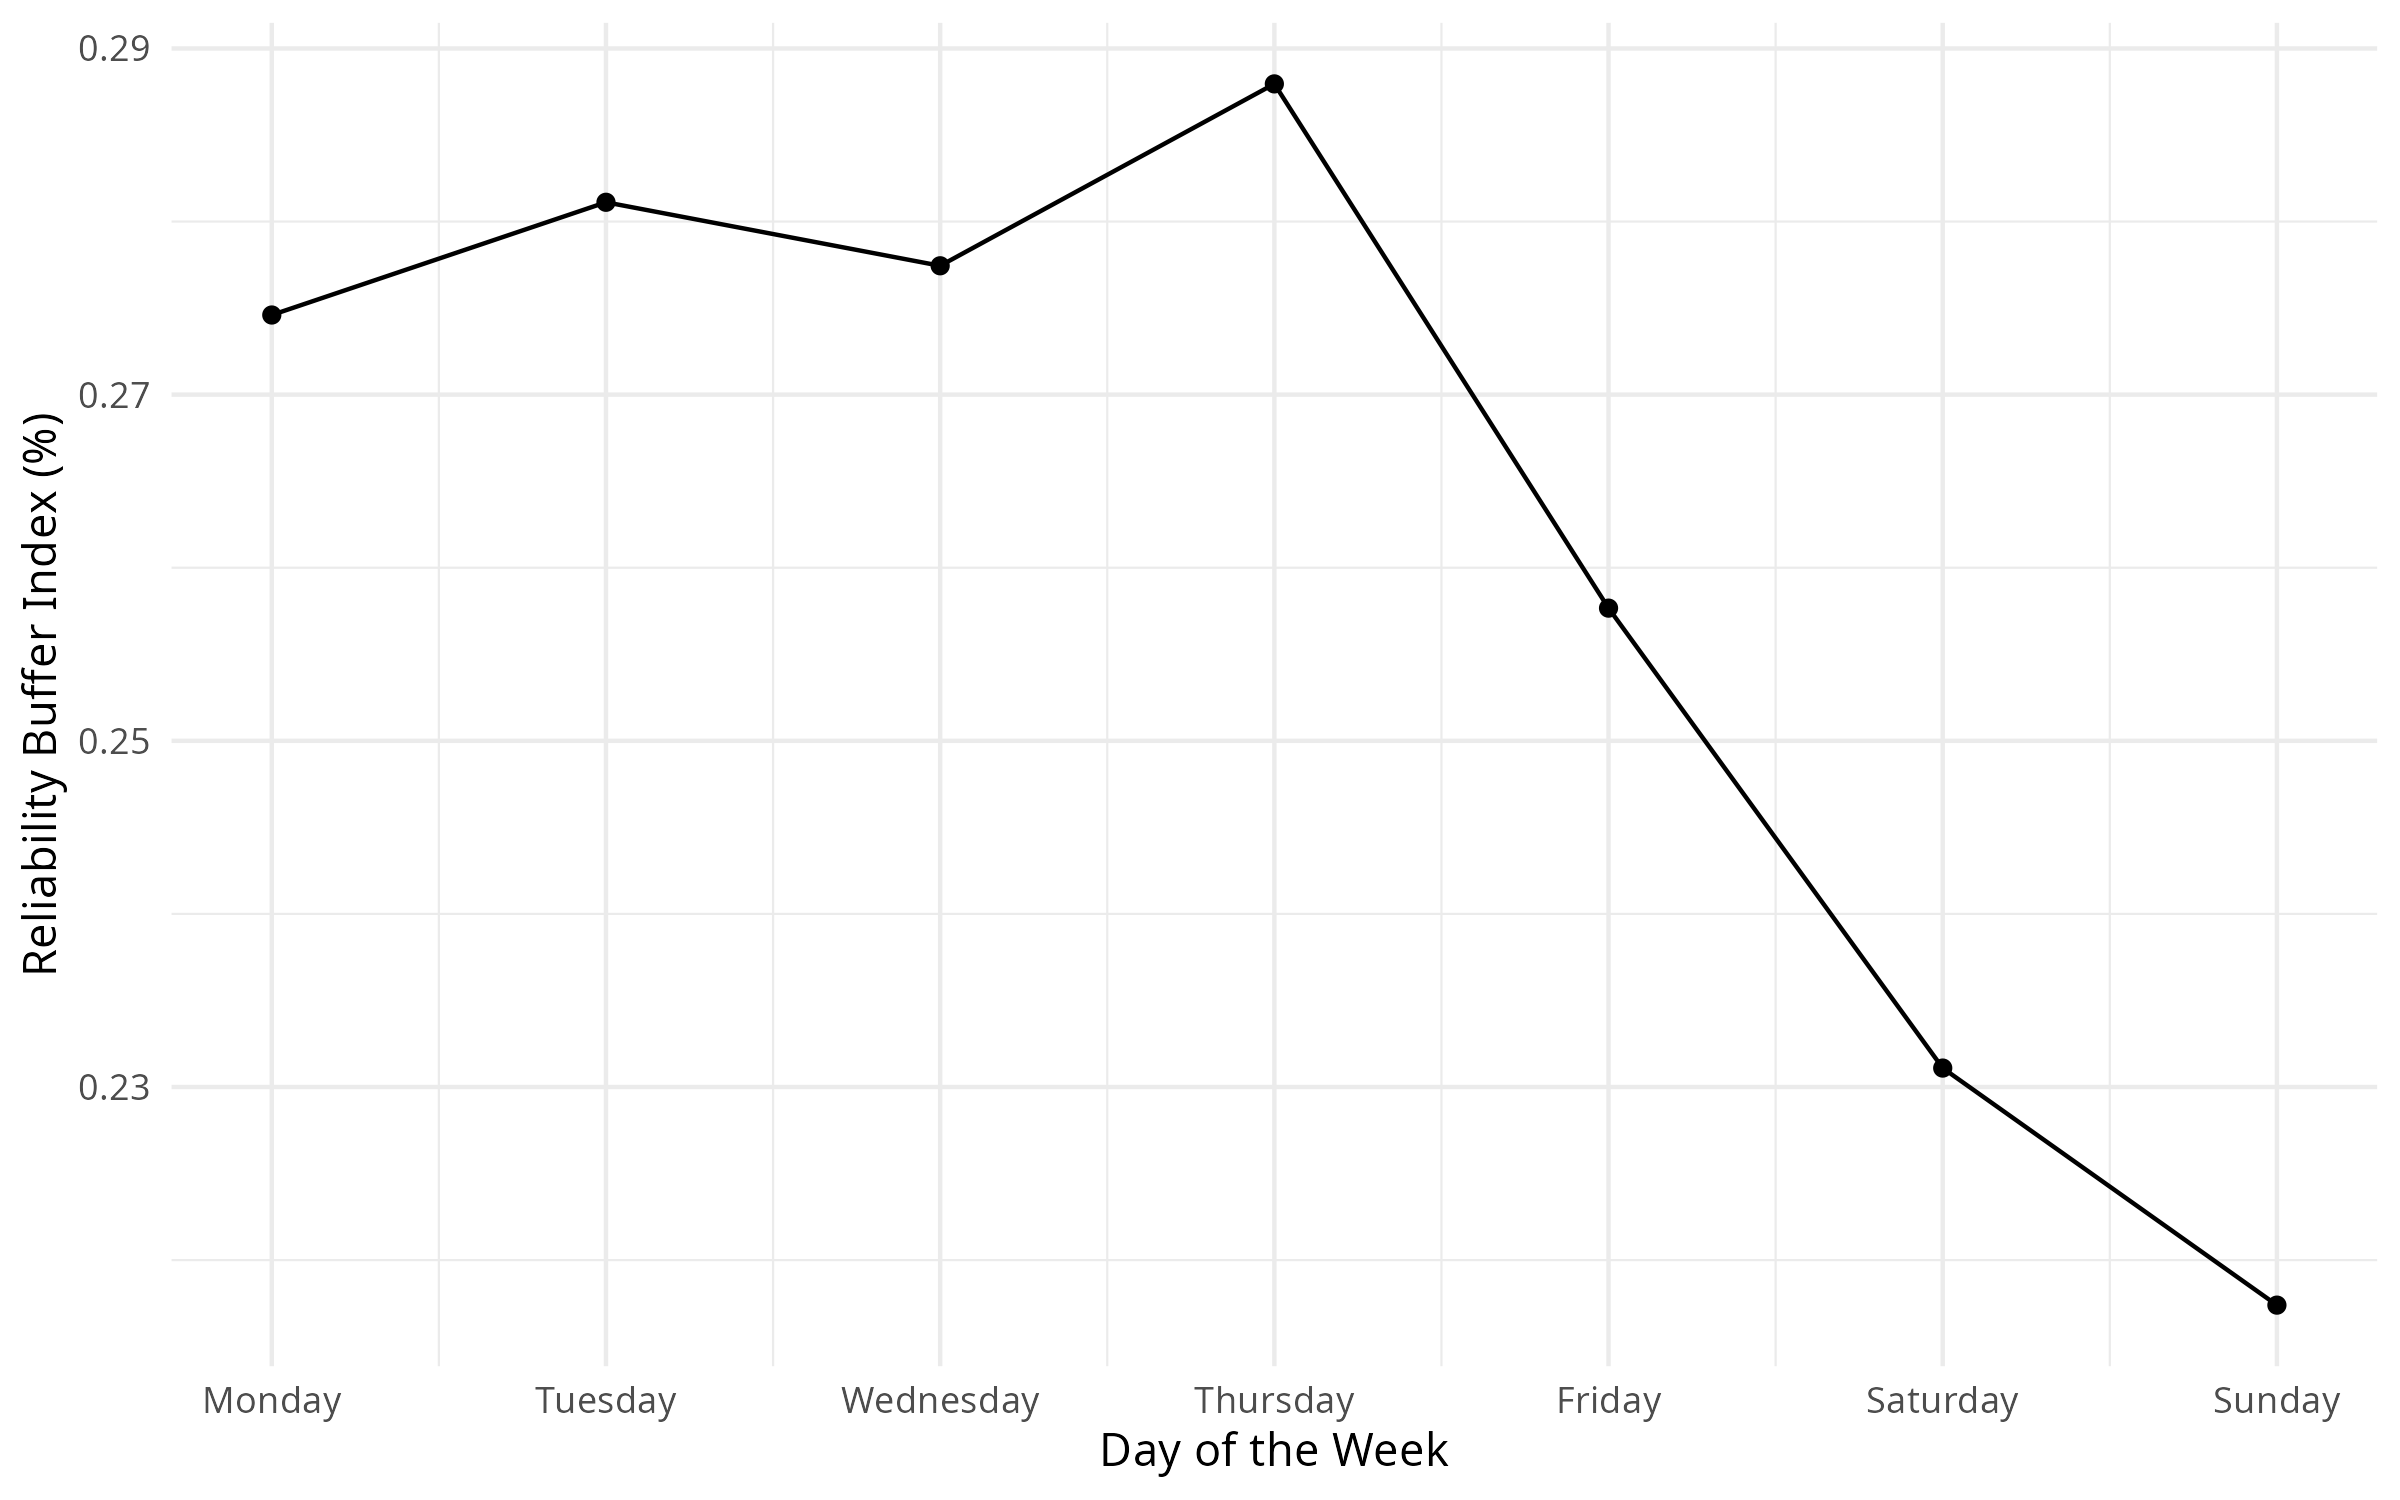
Descriptive stats: RBI
🕐 Greatest impact on business days…
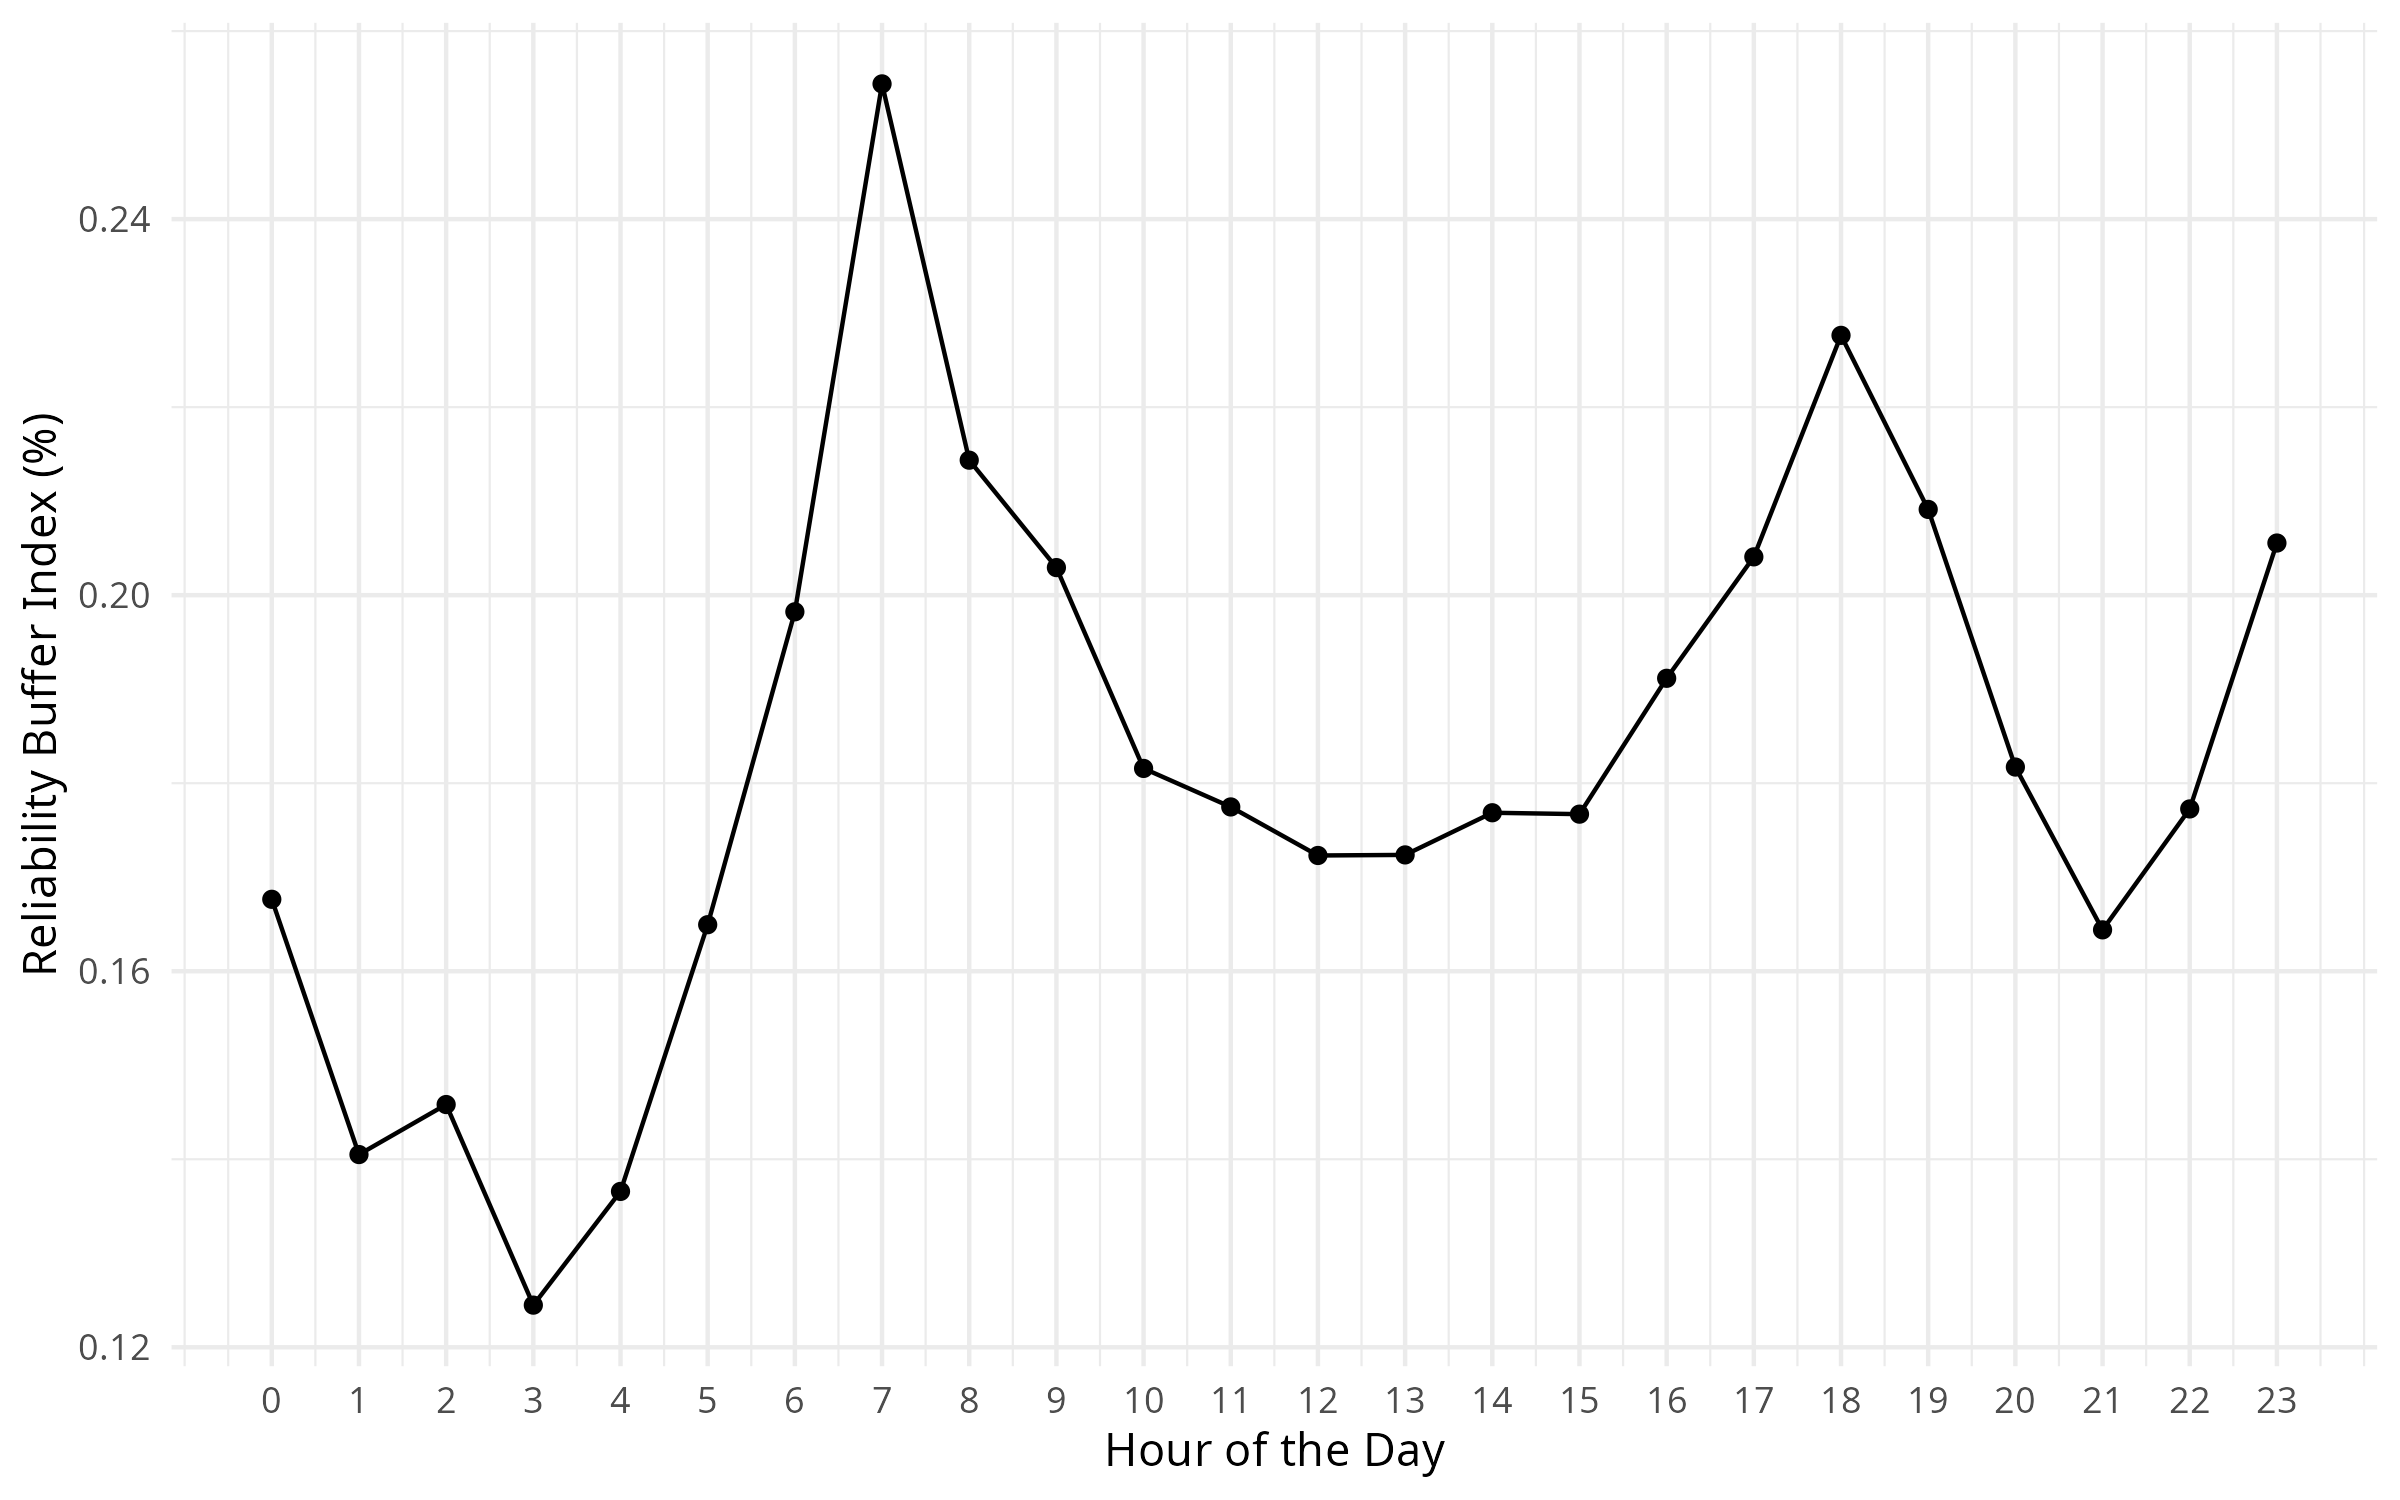
… and during peak hours
Descriptive stats
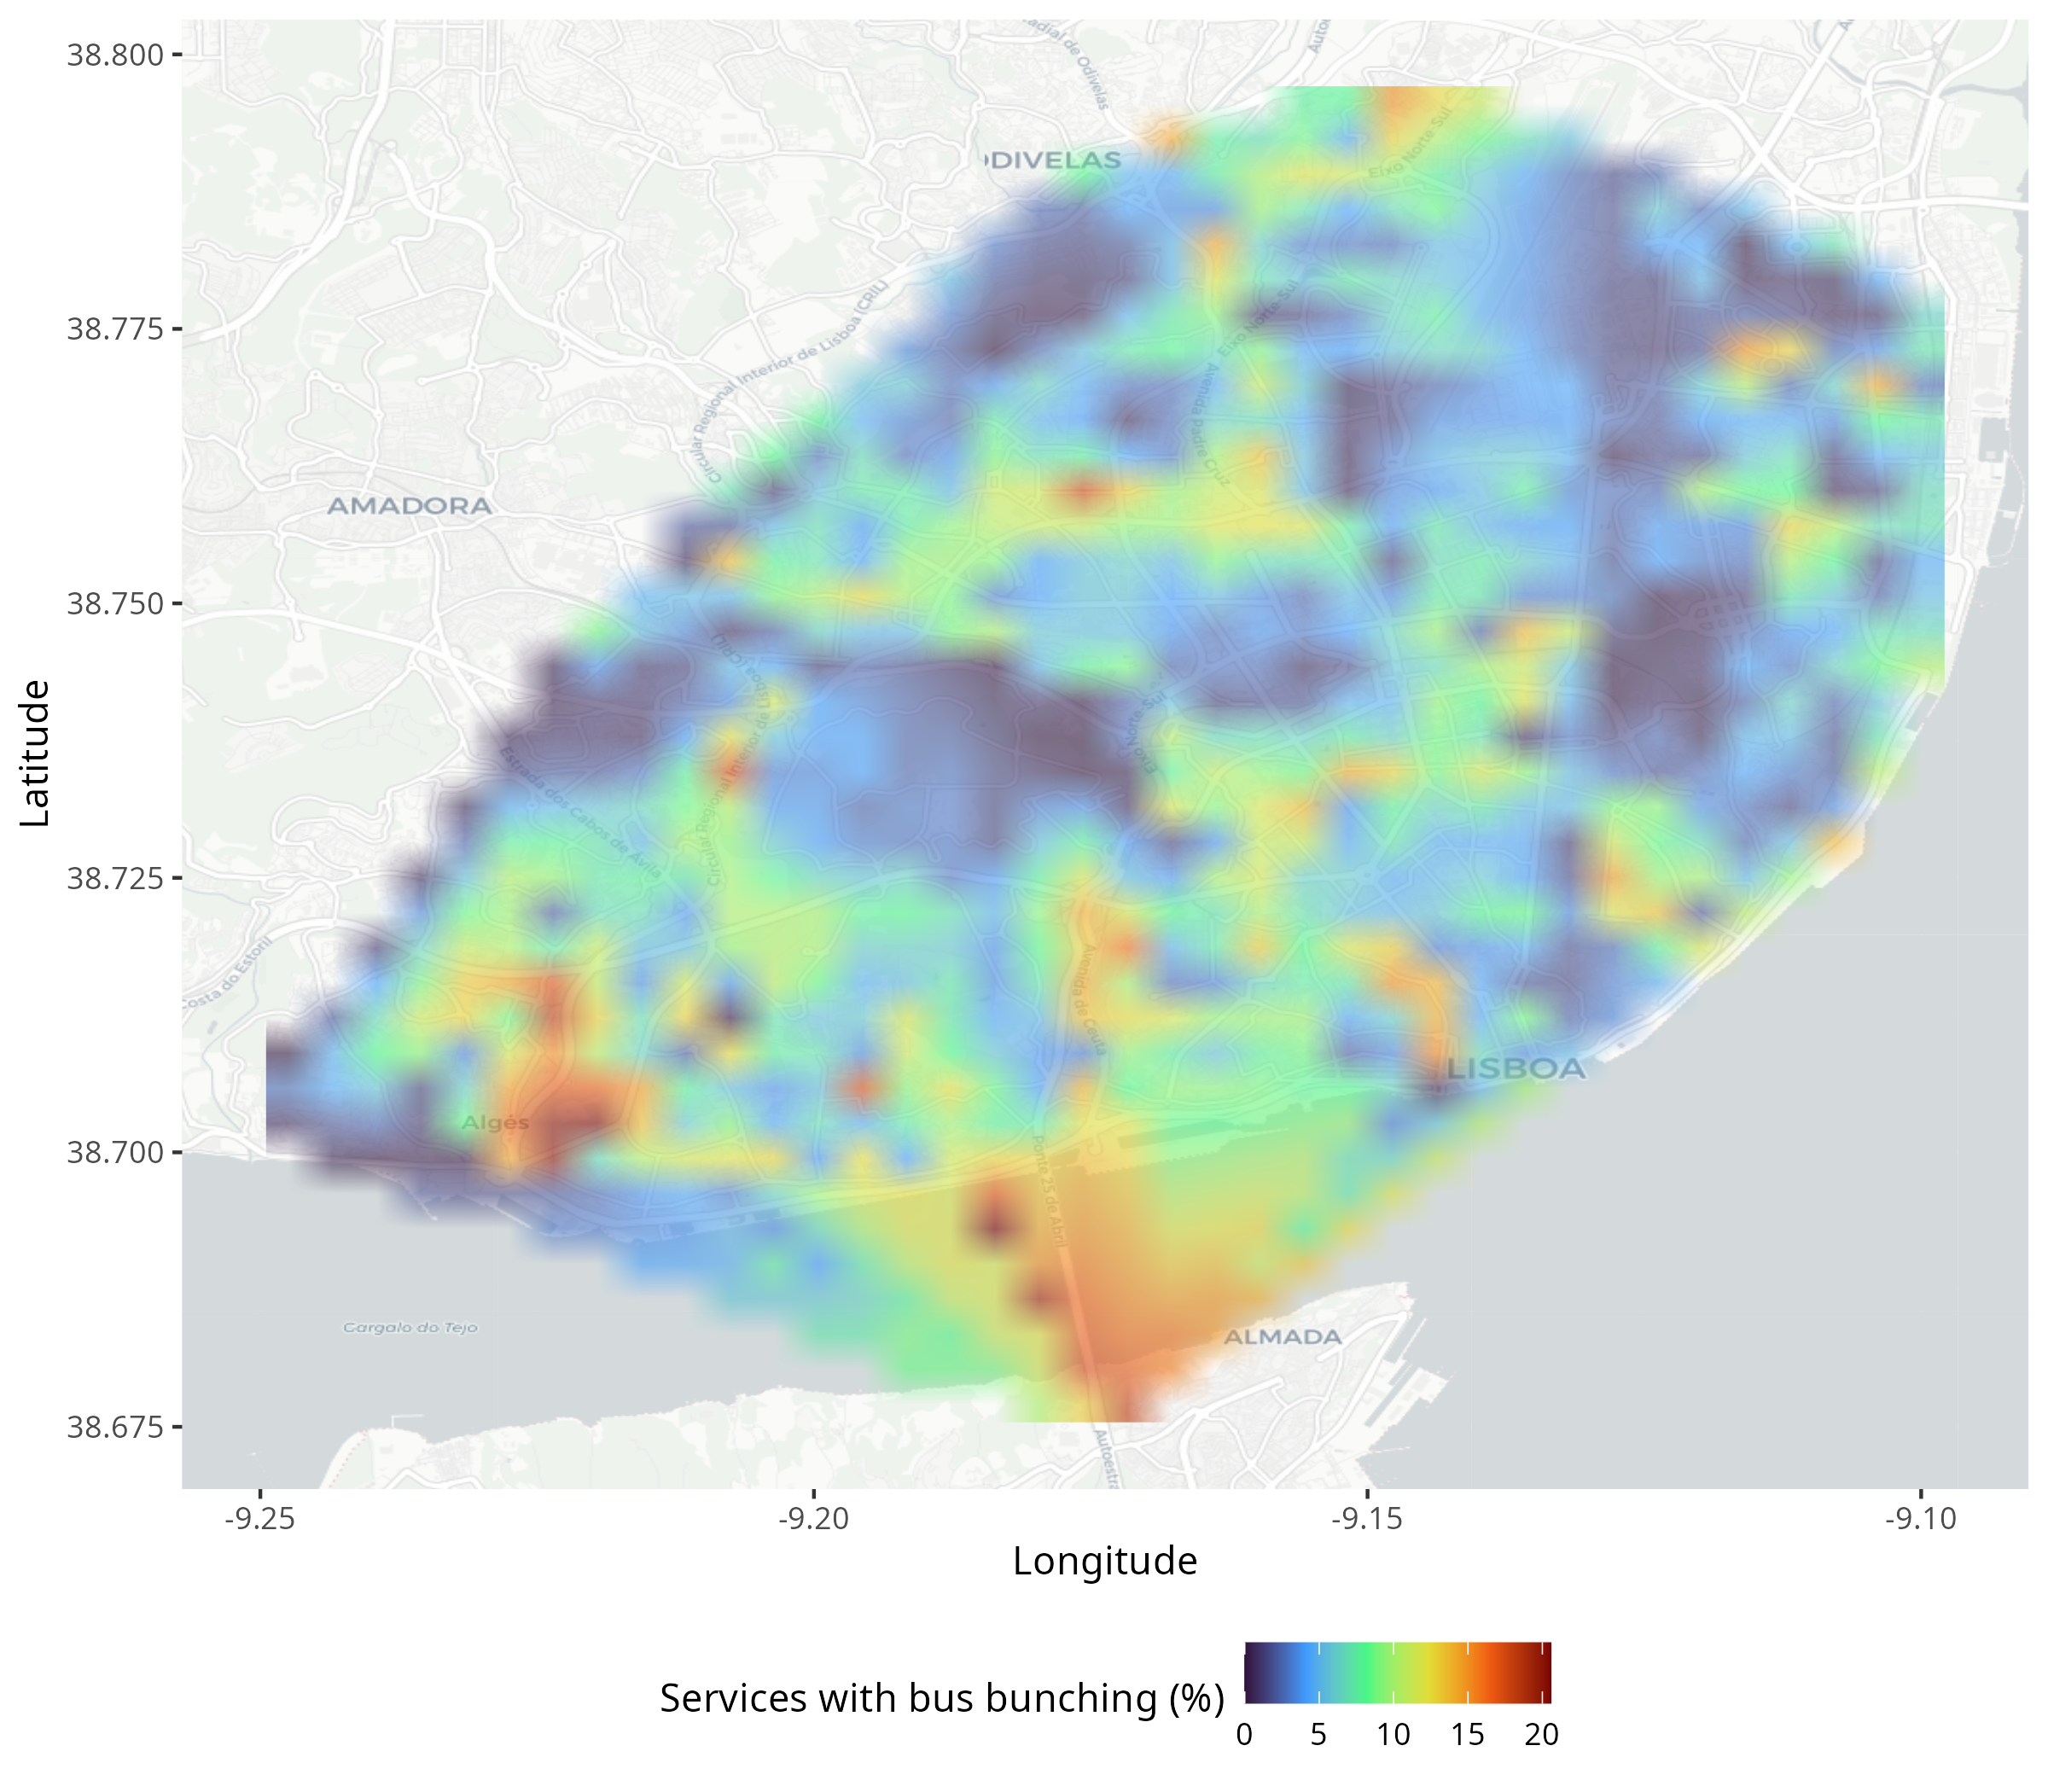
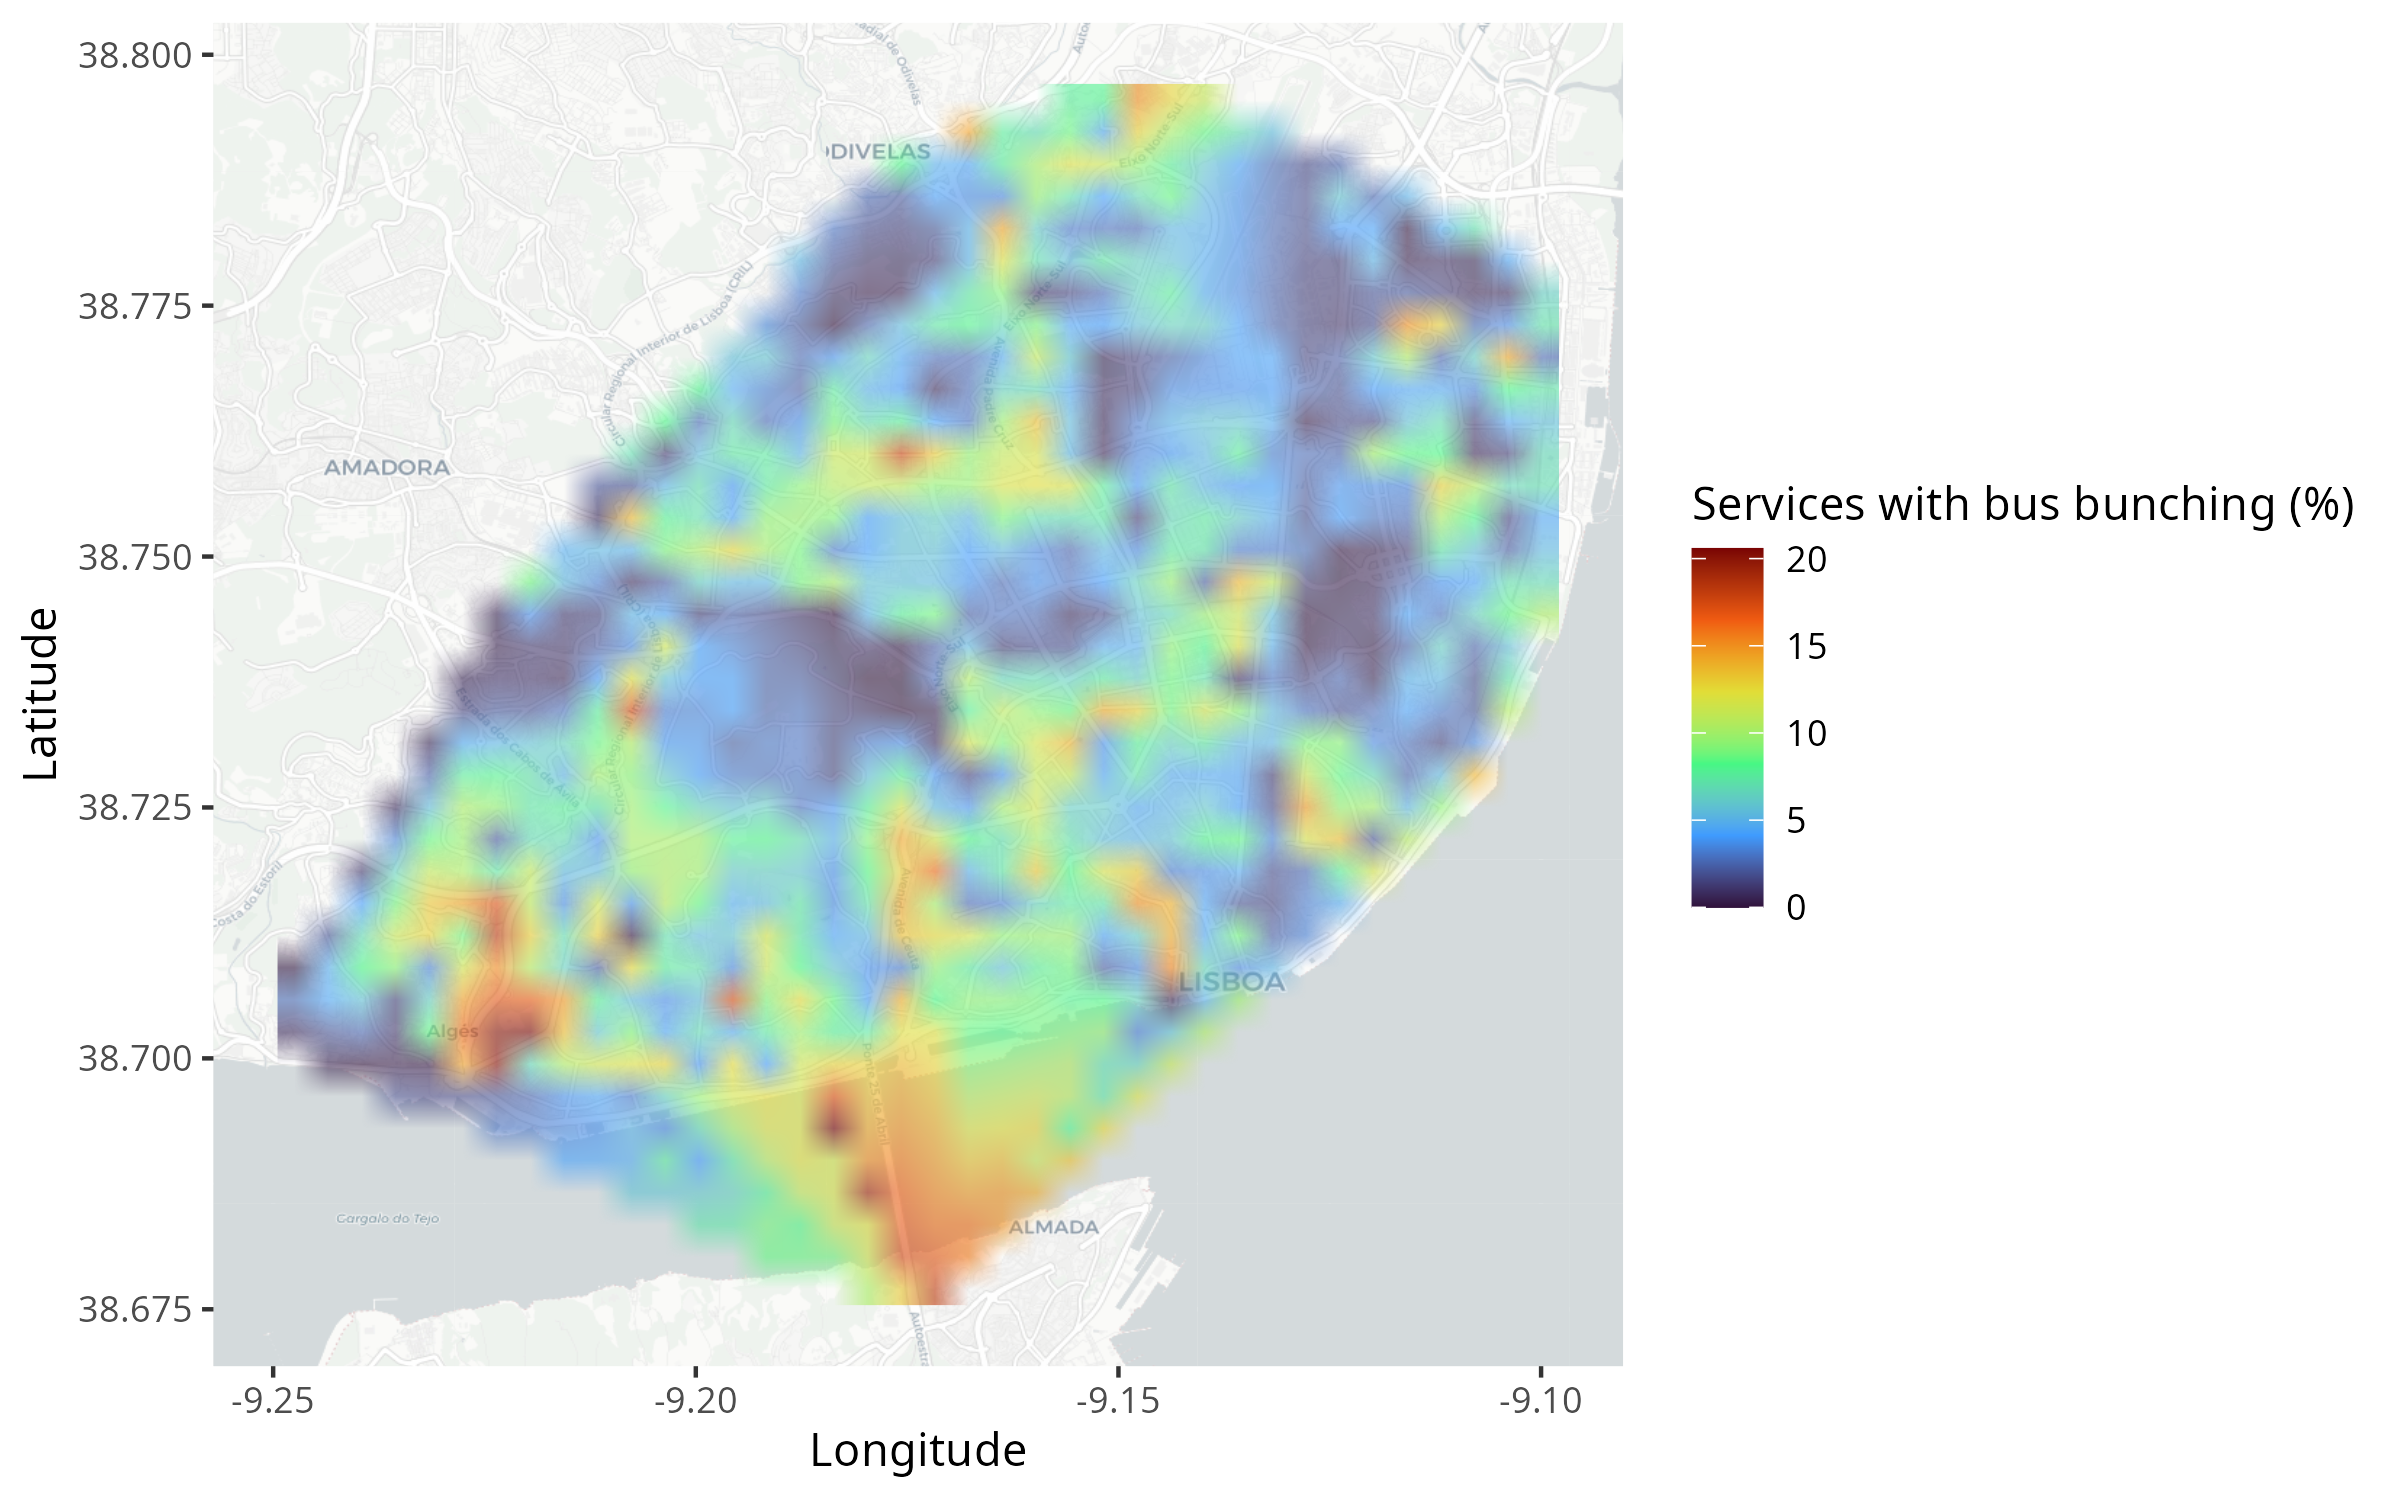
🚌🚌 Bus bunching1 occurs on 7.5% of stop services
Descriptive stats
🚌🚌 Bus bunching1 occurs on 7.5% of stop services
| Stop | Route | % Services bunched |
|---|---|---|
| Belém (Museu Coches) | 751 | 25.8 |
| R. Alecrim | 758 | 25.6 |
| Altinho (MAAT) | 751 | 25.6 |
| Portas Benfica | 758 | 25.5 |
Descriptive stats: bus bunching
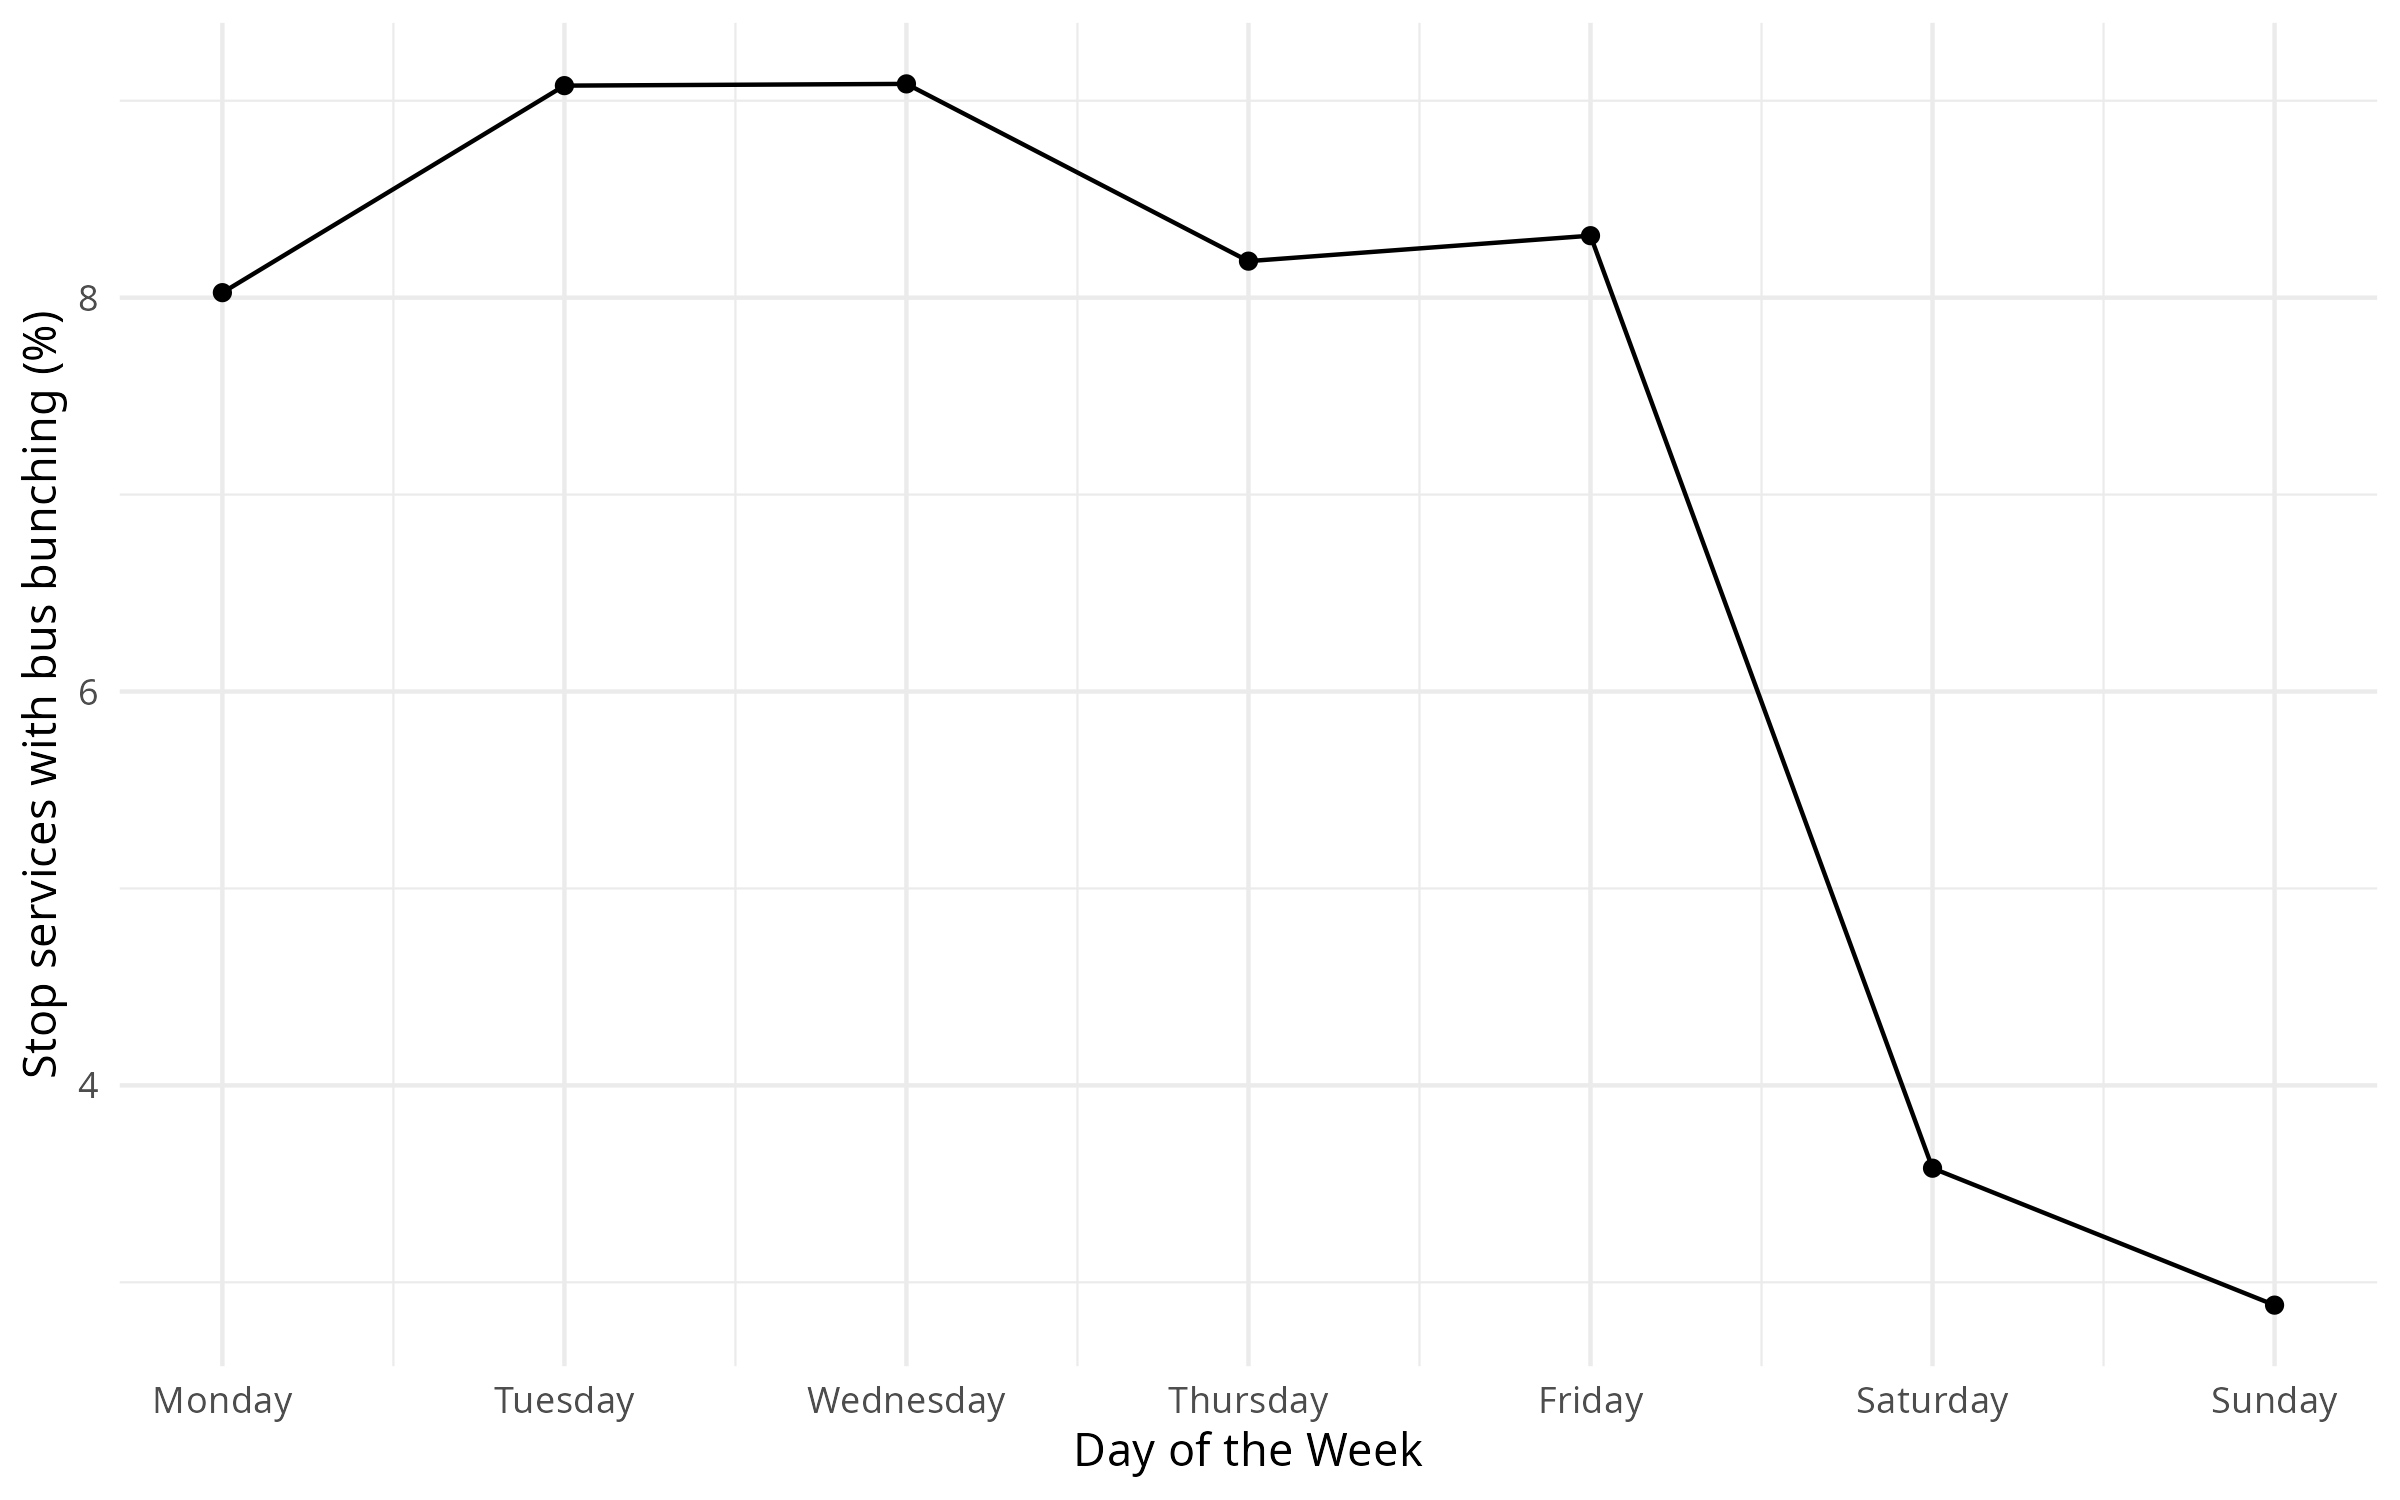
🕐 Greatest impact on business days…
Descriptive stats: bus bunching
🕐 Greatest impact on business days…
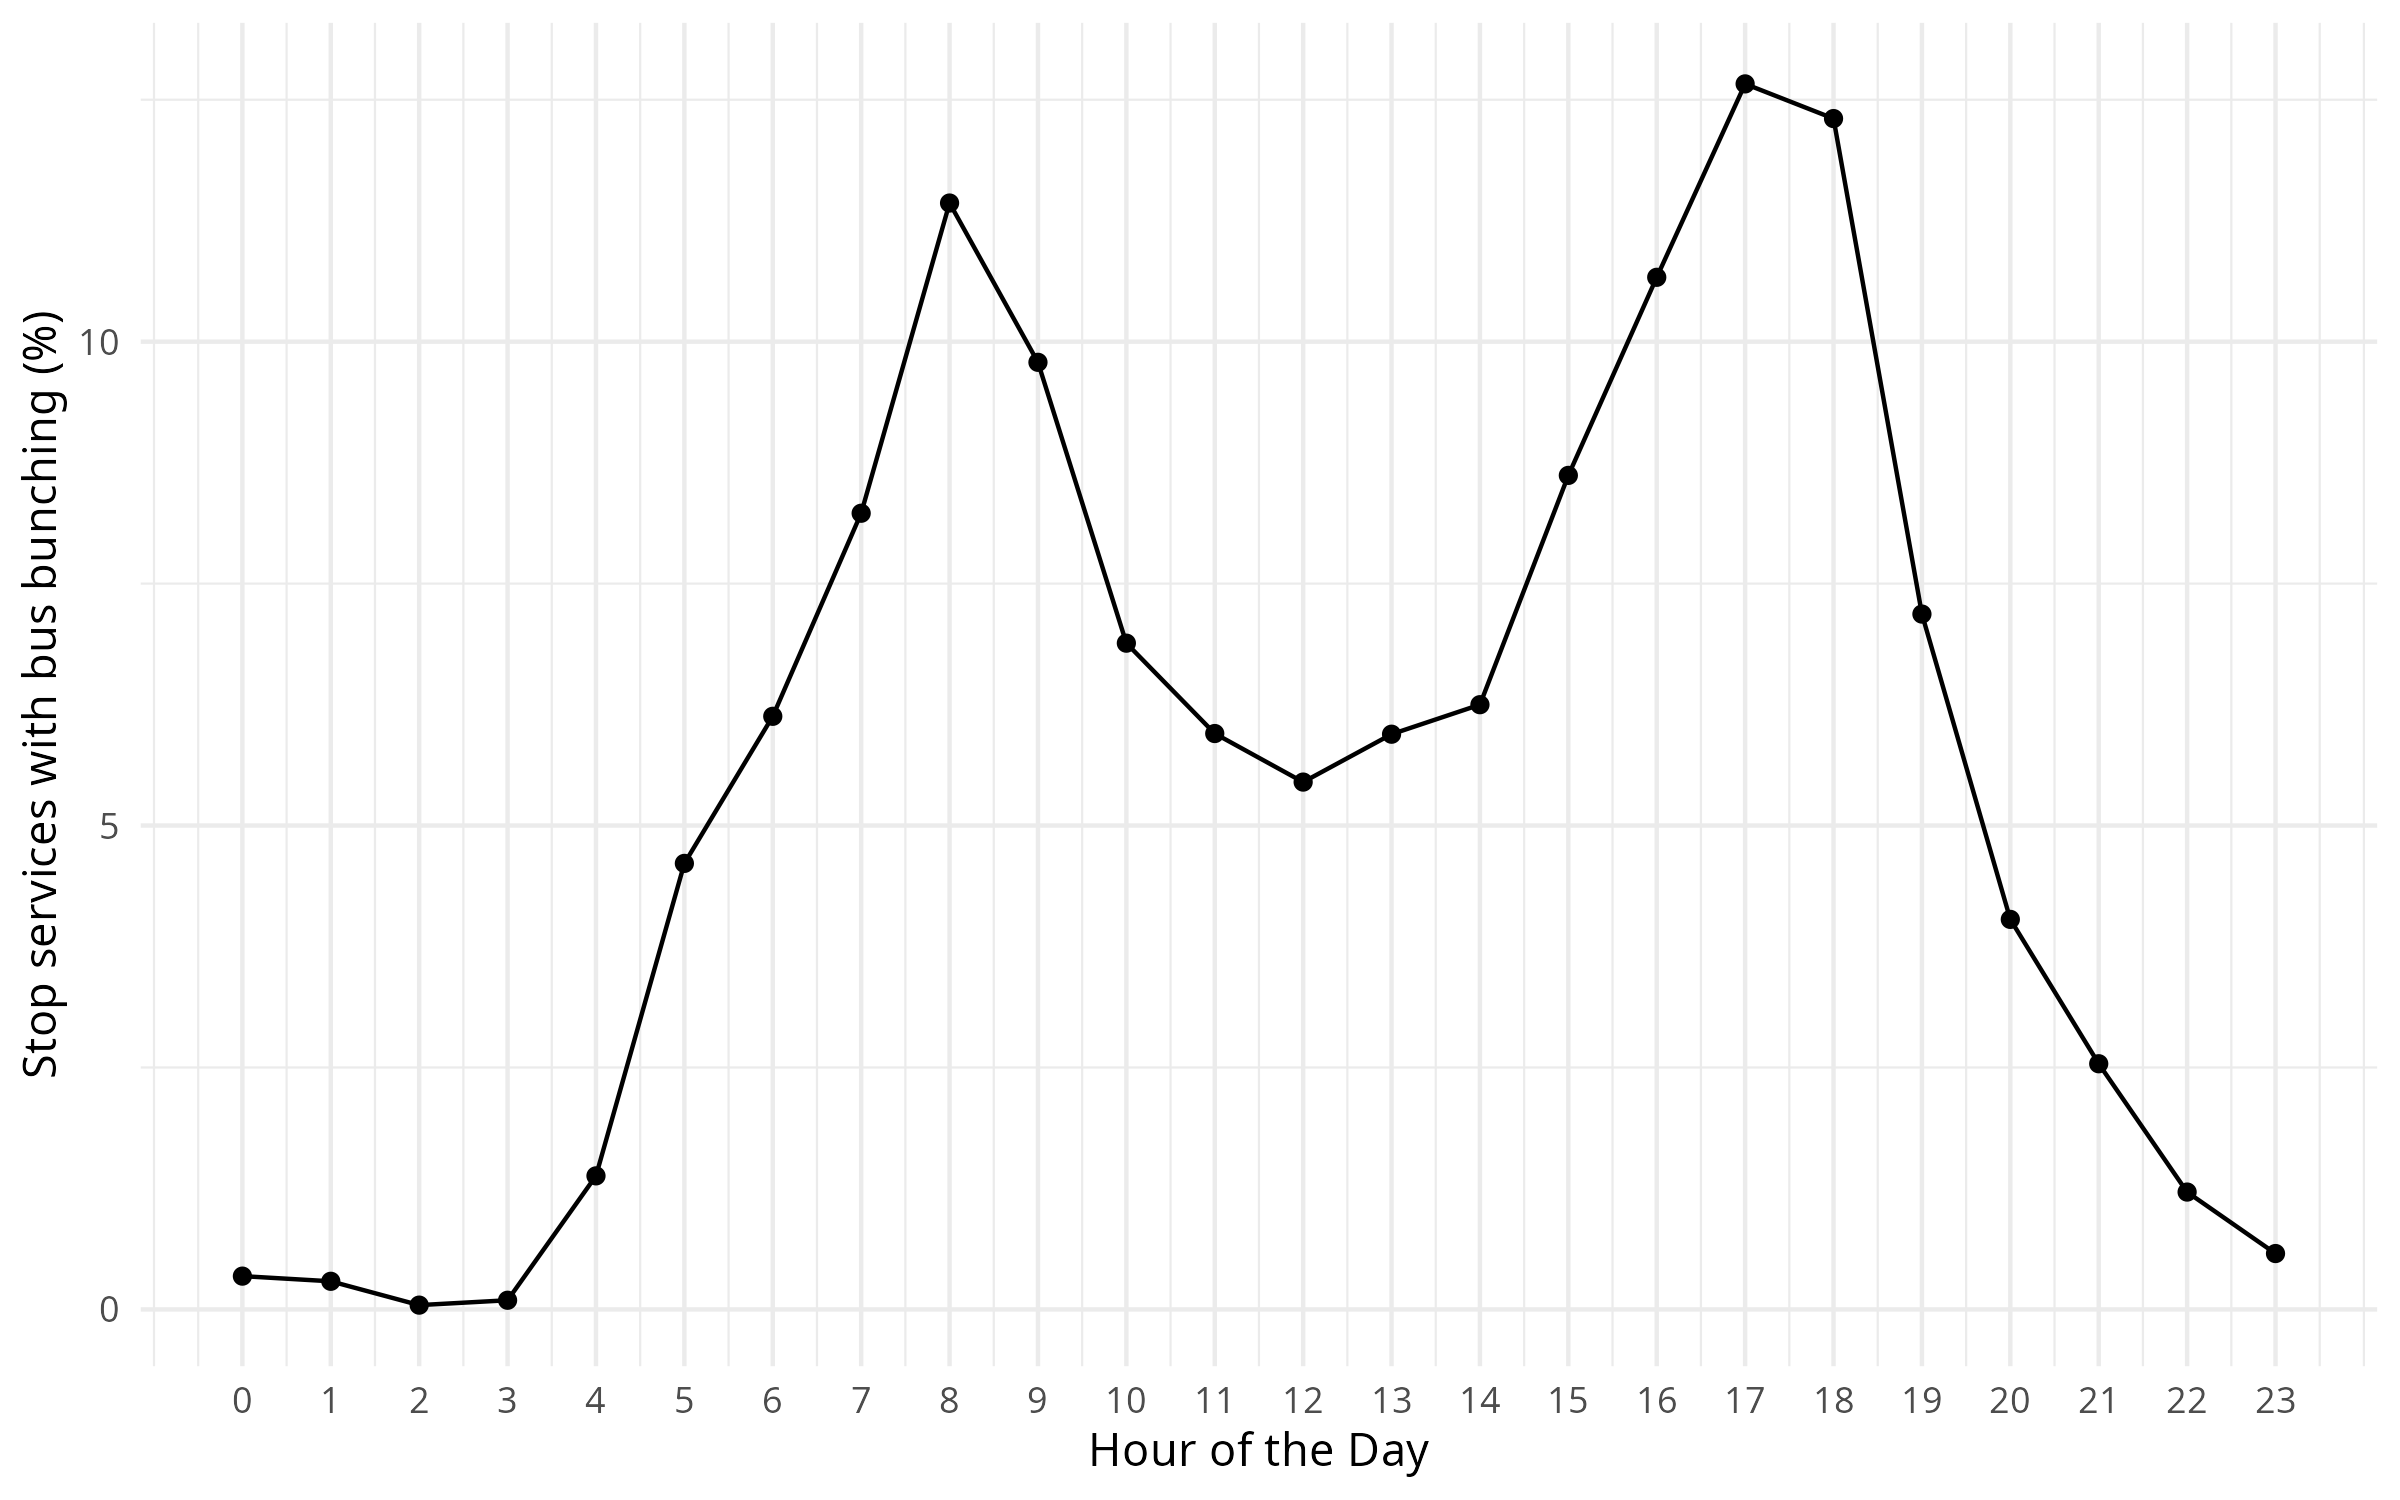
… and during peak hours
Descriptive stats: bus bunching
🛣️ Do bus lanes have an influence?
On stops served by bus lanes (14.6%), 8.38% of the services are bunched
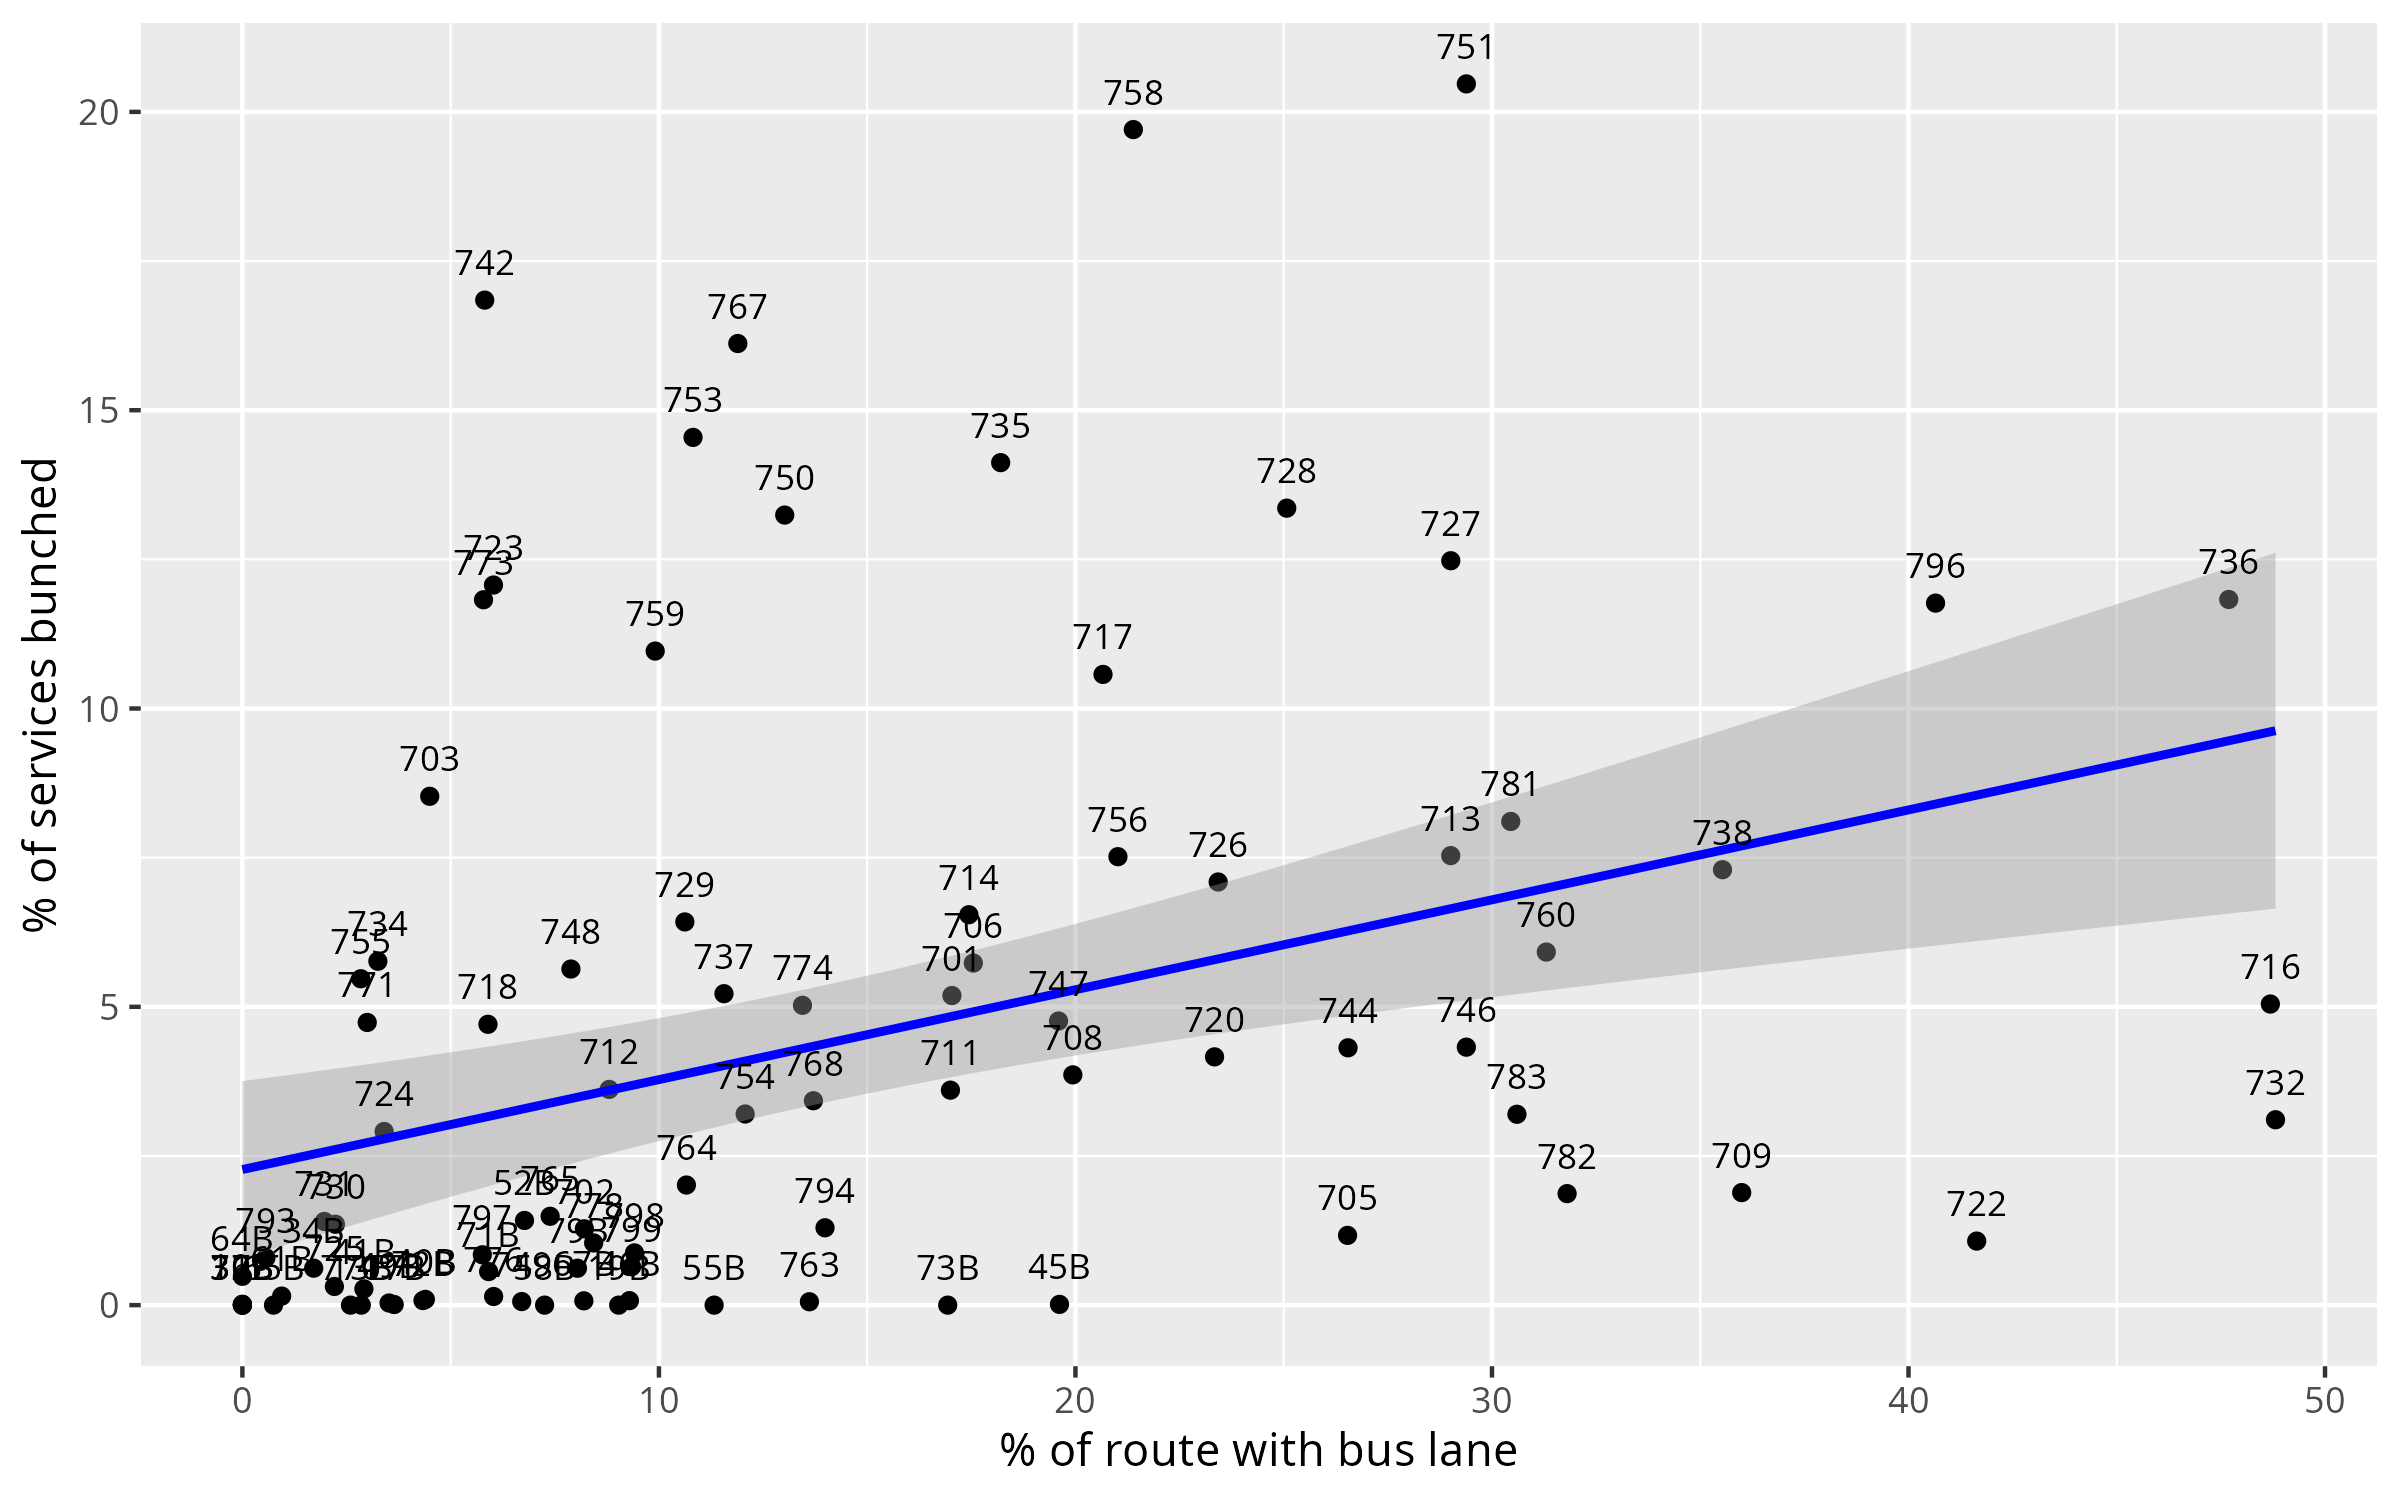
Routes that pass through bus lanes do not seem to register less bunching, actually data suggests the opposite occurs (R² = 0.13, r = 0.36, p < 0.001)
Descriptive stats: shortenings
🕐 Greatest impact in the middle of the week and Saturdays…
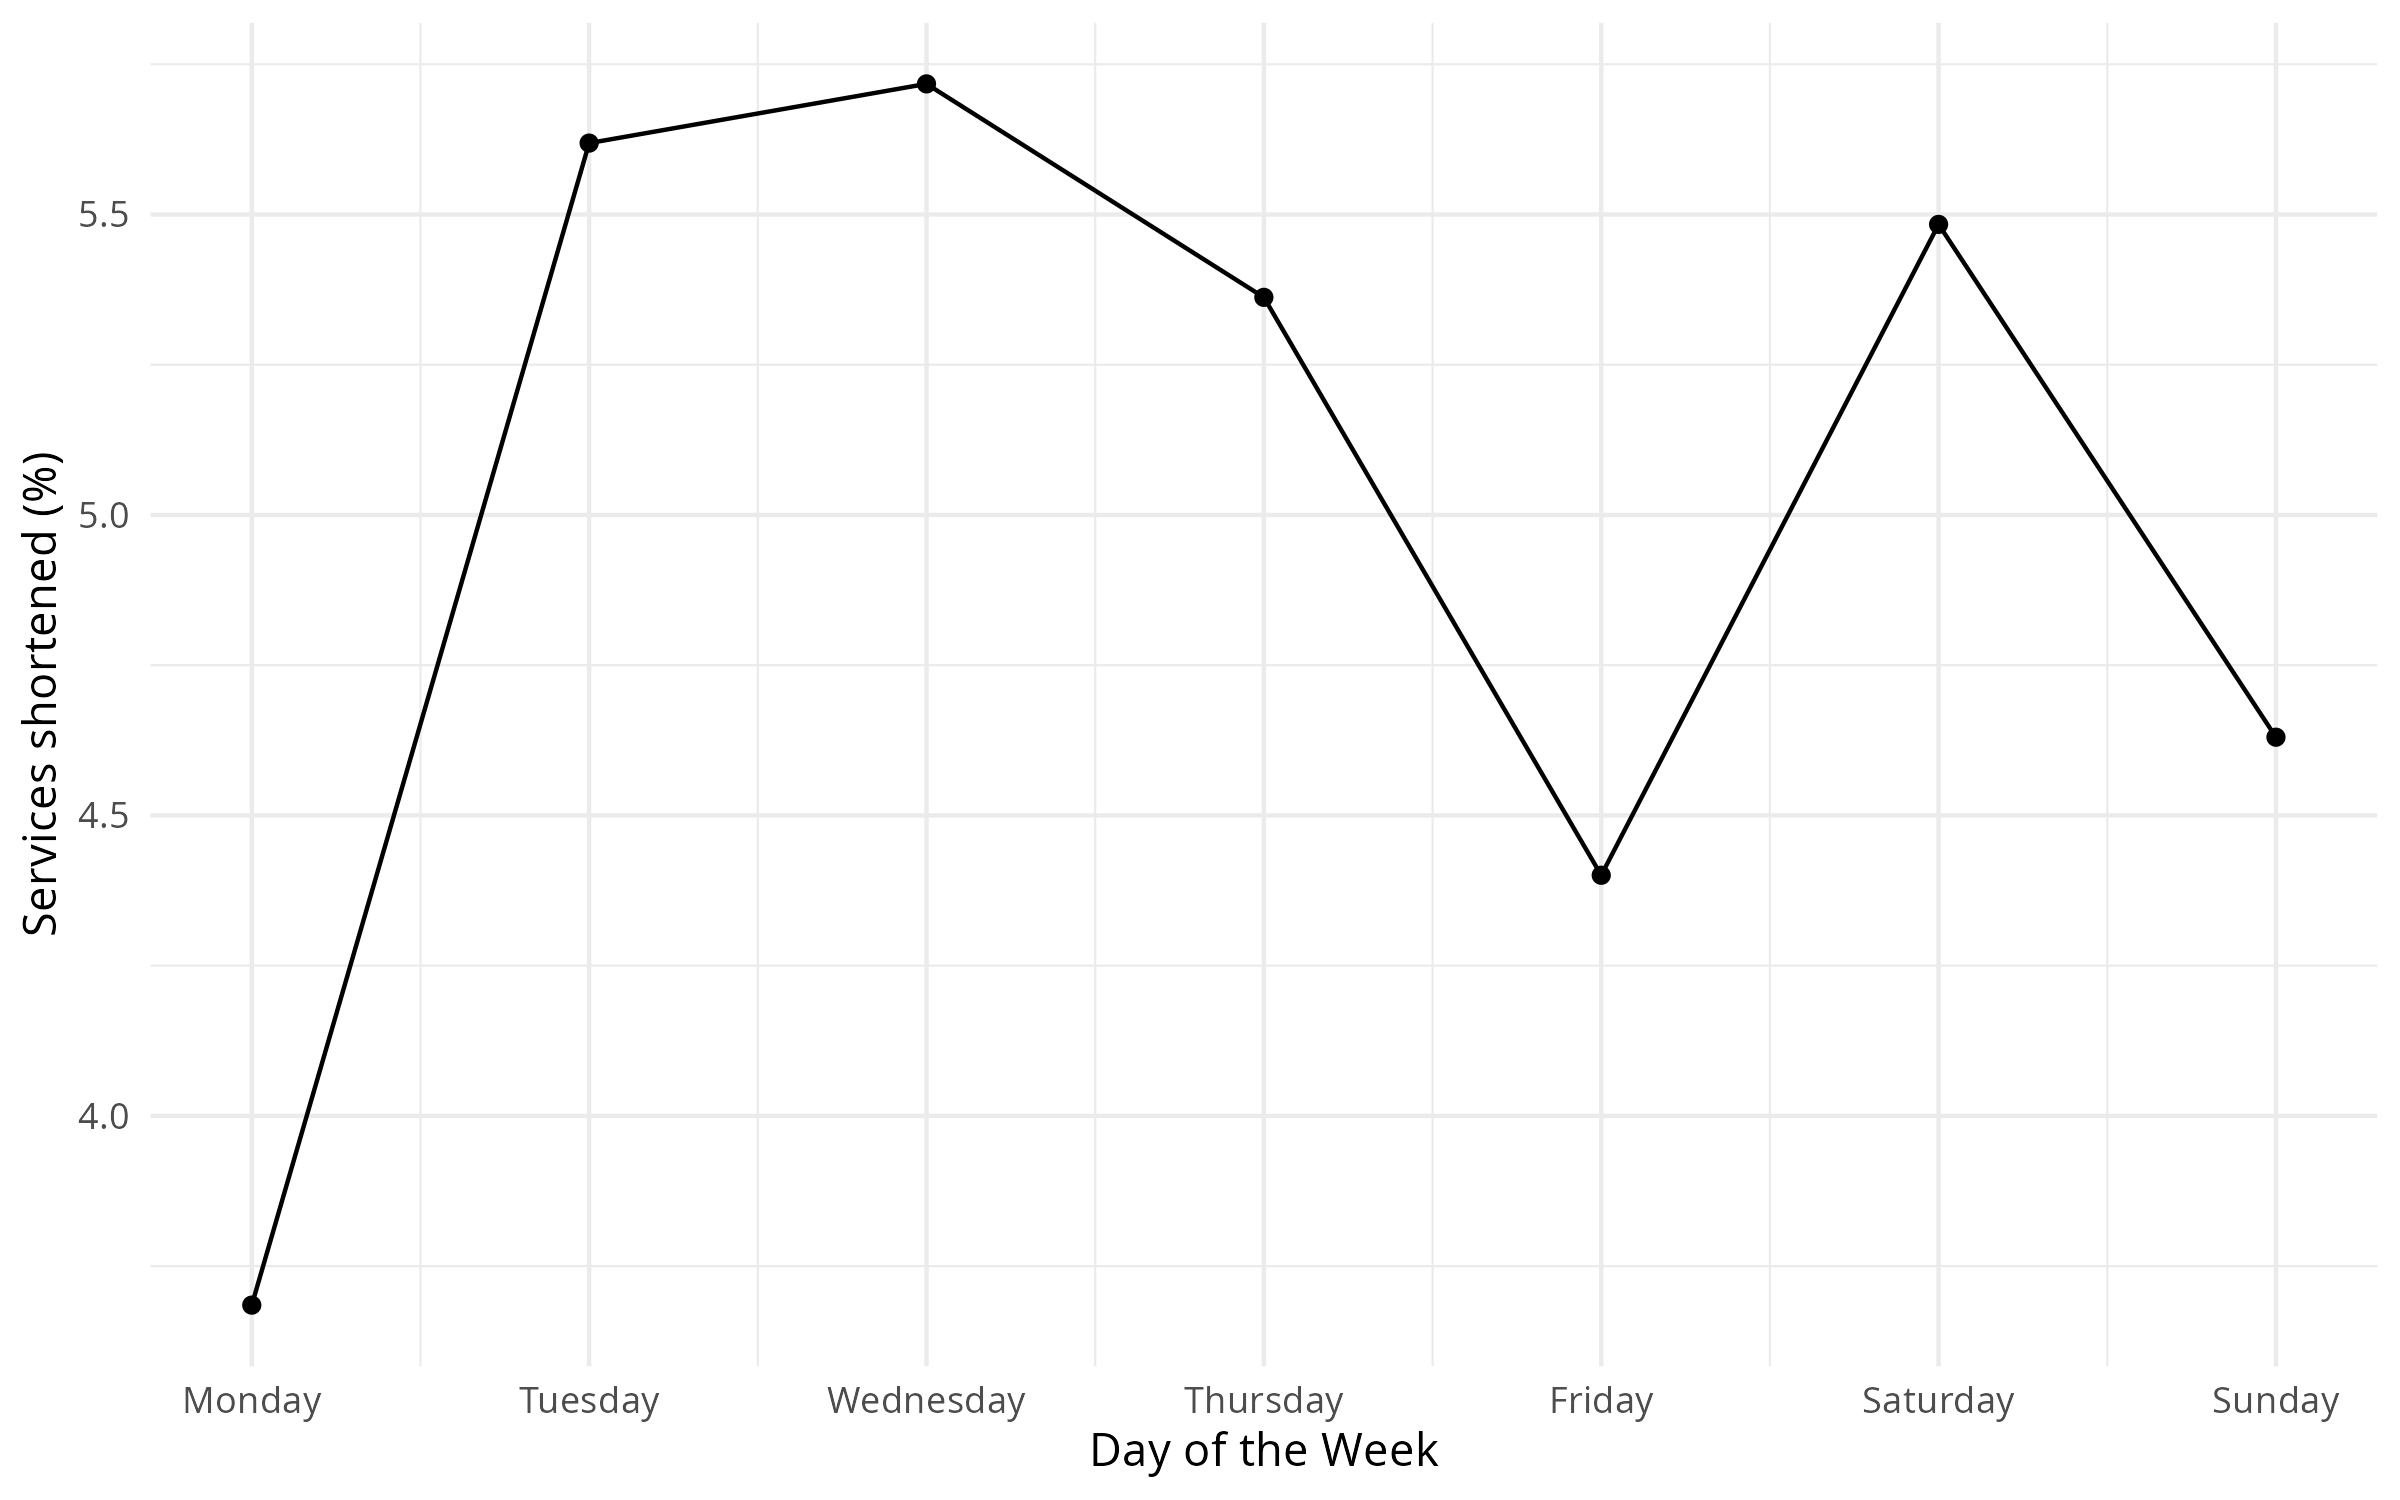
Descriptive stats: shortenings
🕐 Greatest impact in the middle of the week and Saturdays…
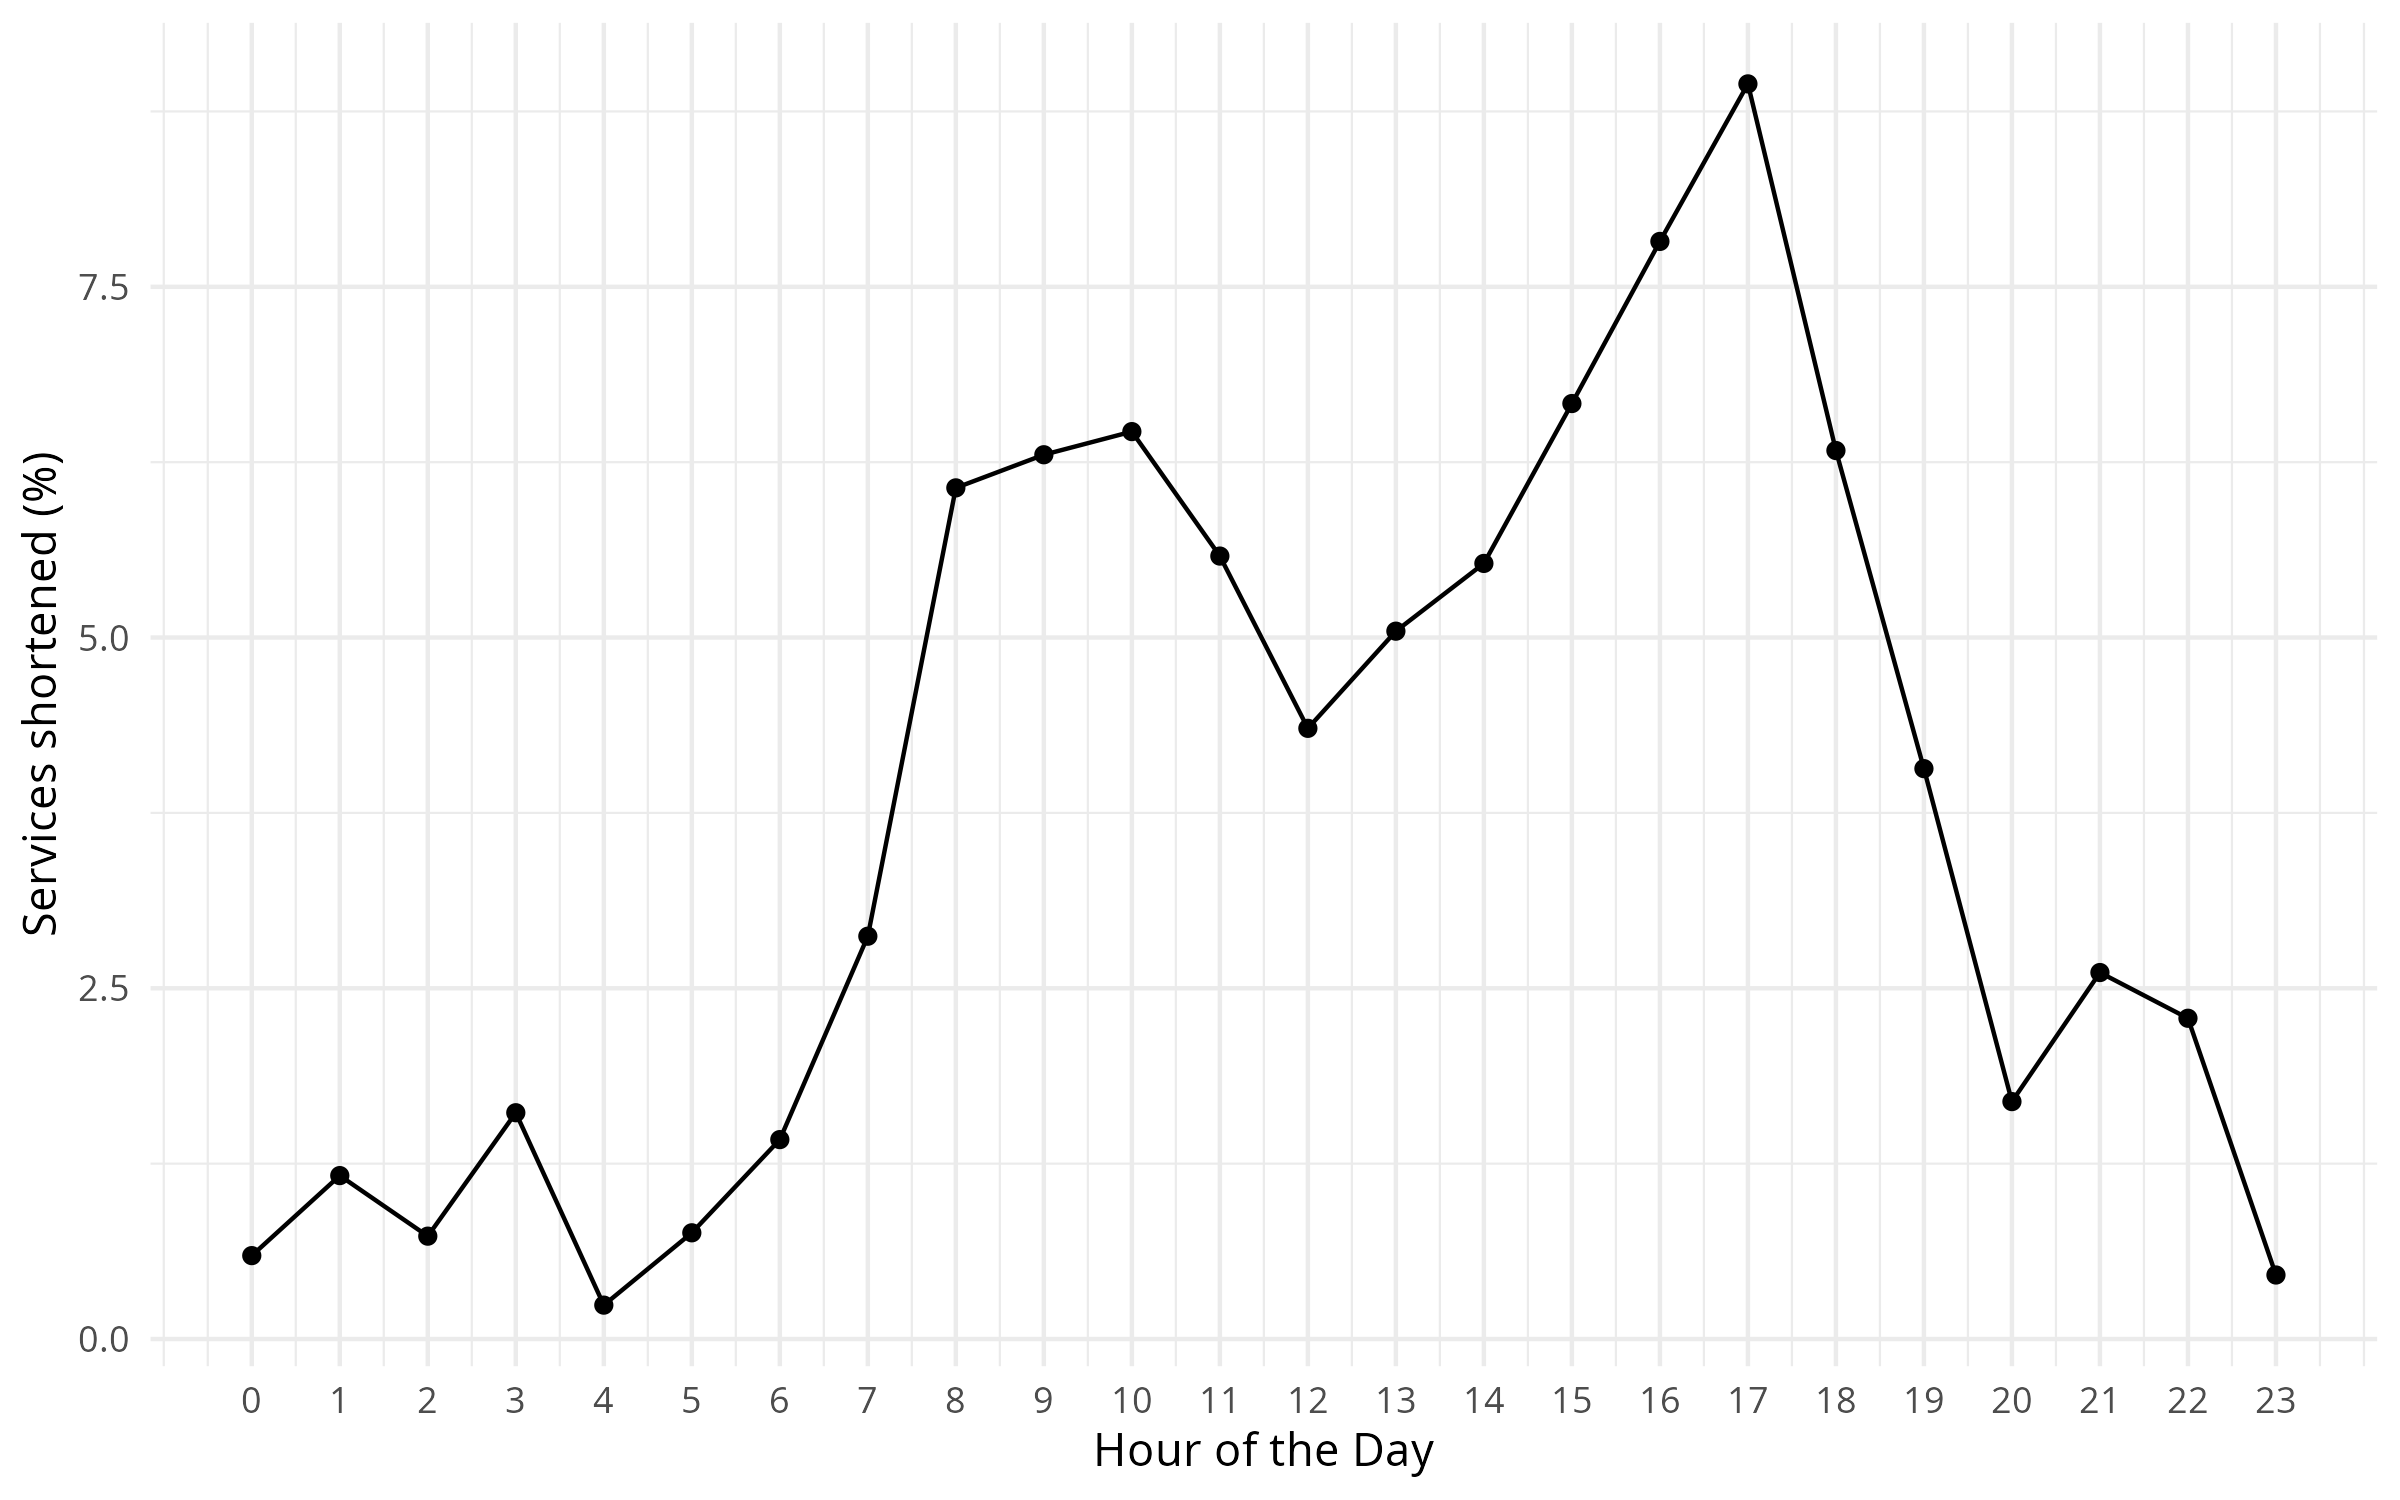
… and during peak hours
Descriptive stats: shortenings
📏 Does route length influence the number of shortenings?
There is a statistically significant positive exponential relationship between the variables
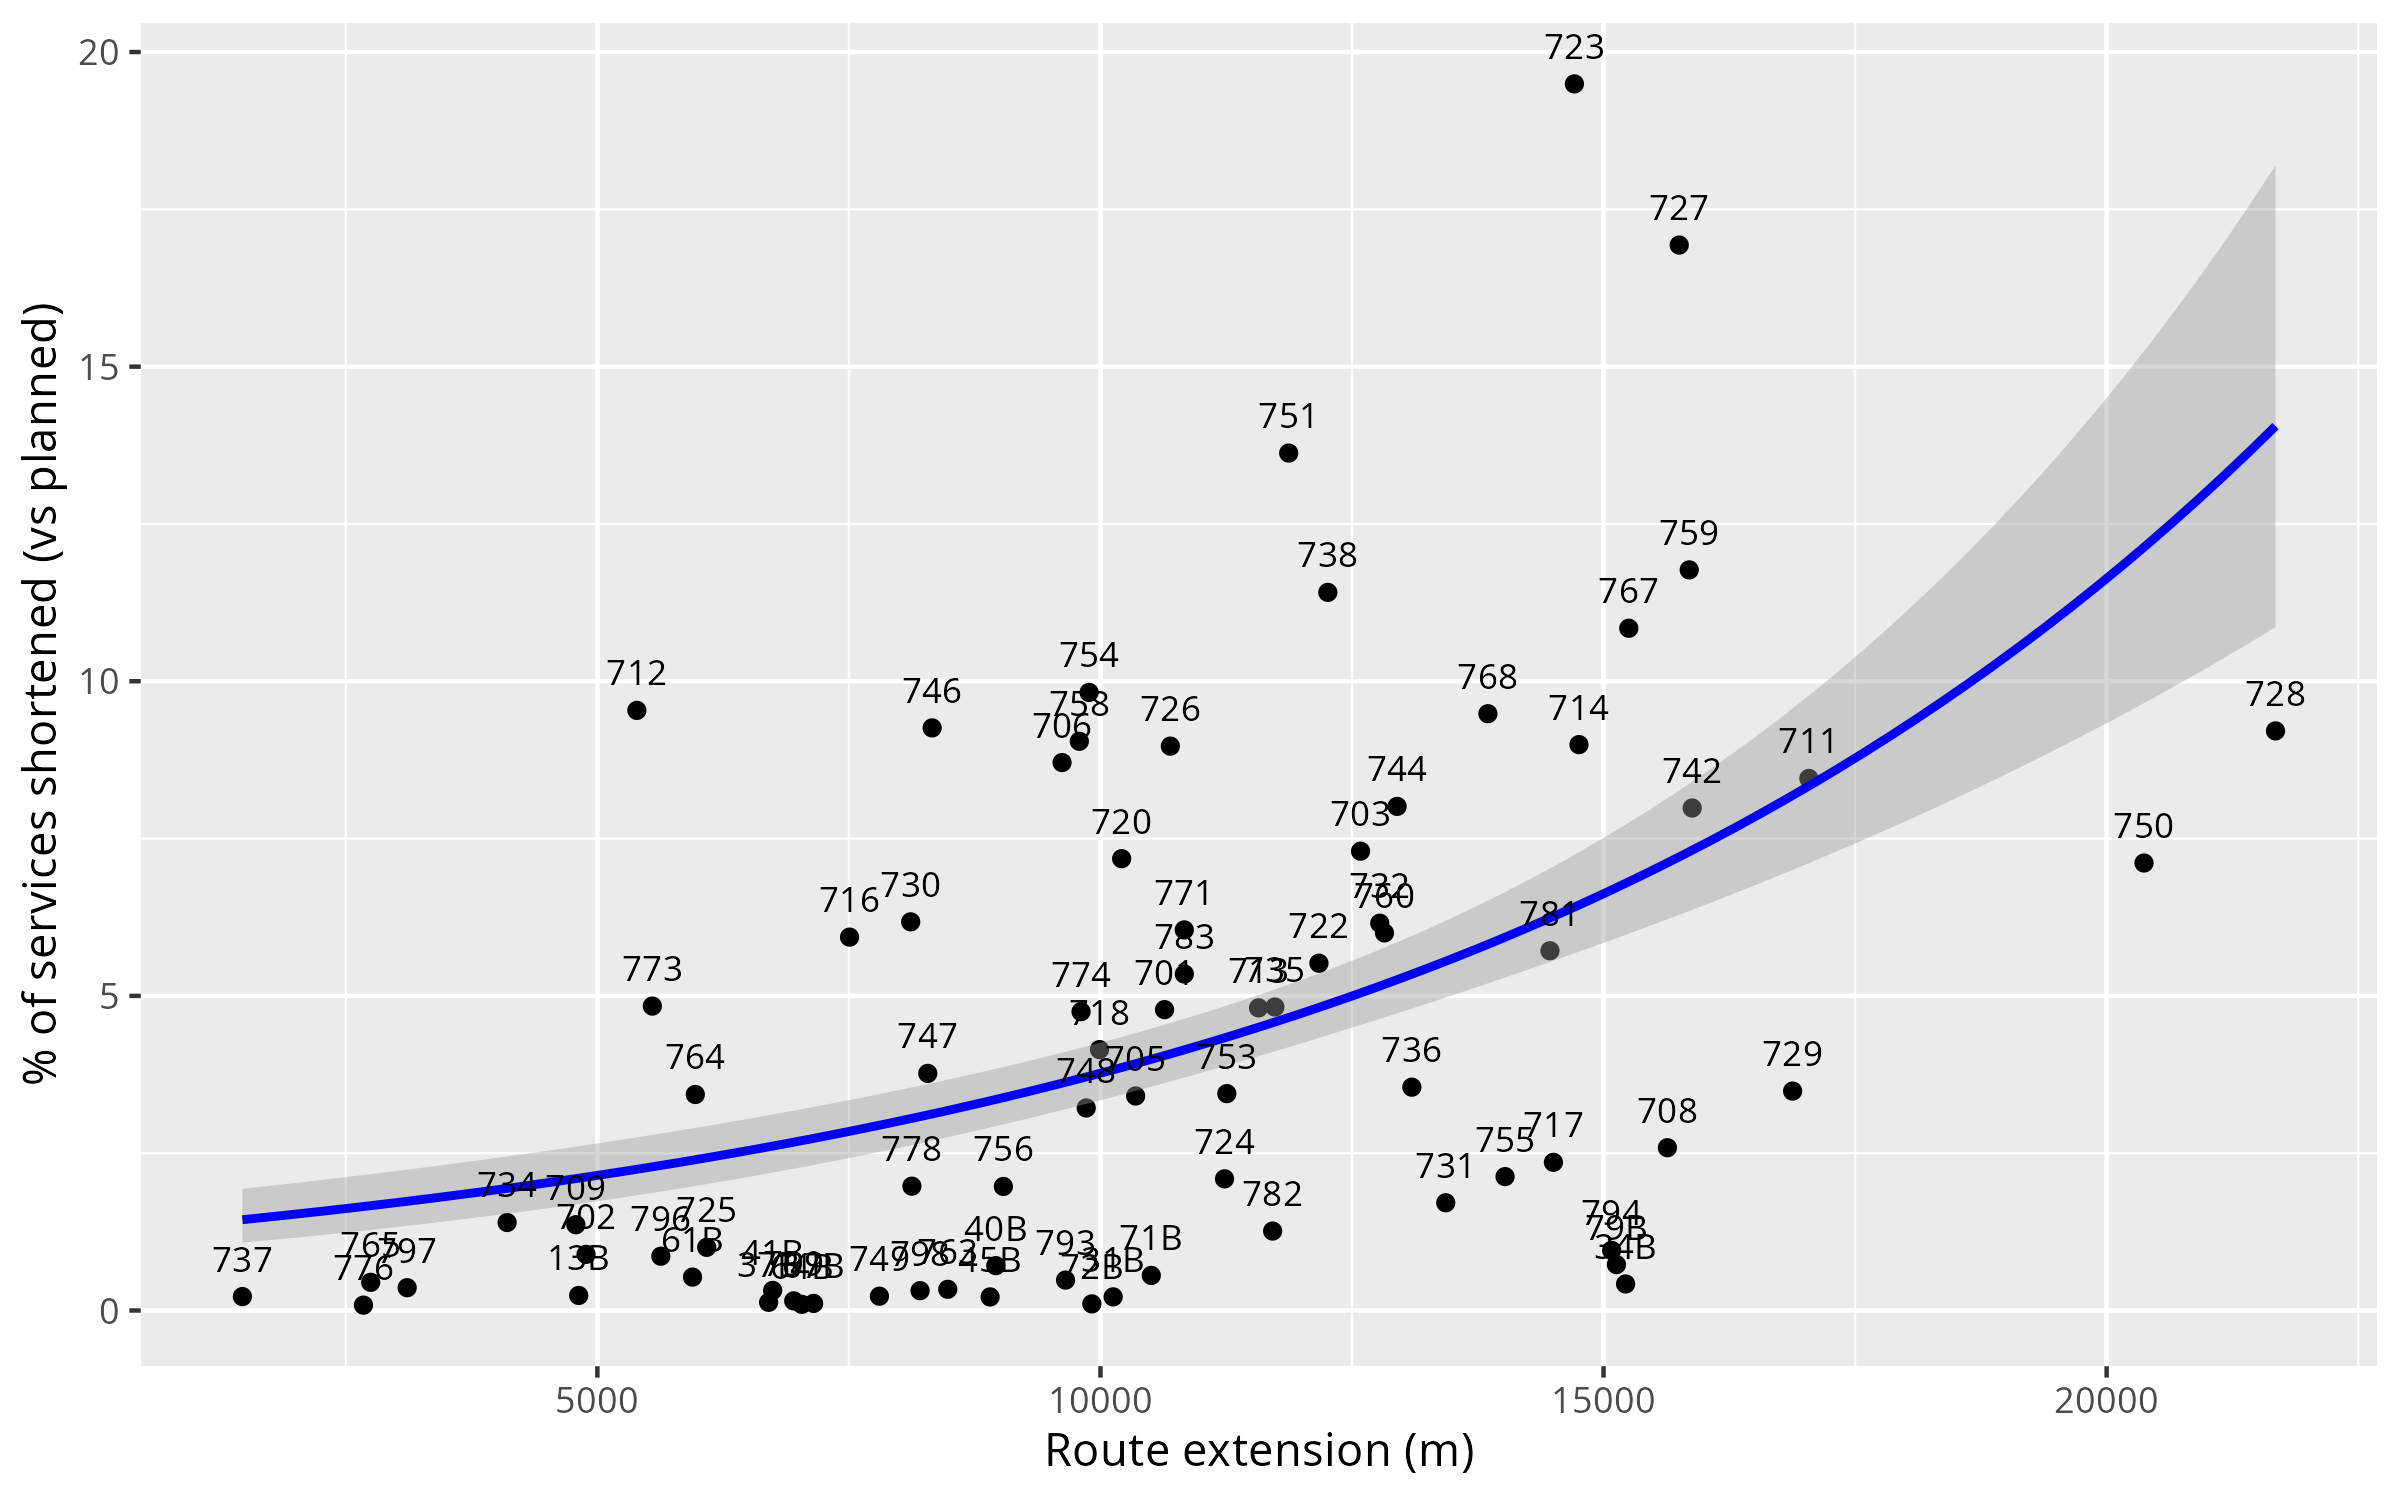
R² = 0.29, r = 0.54, p < 0.001
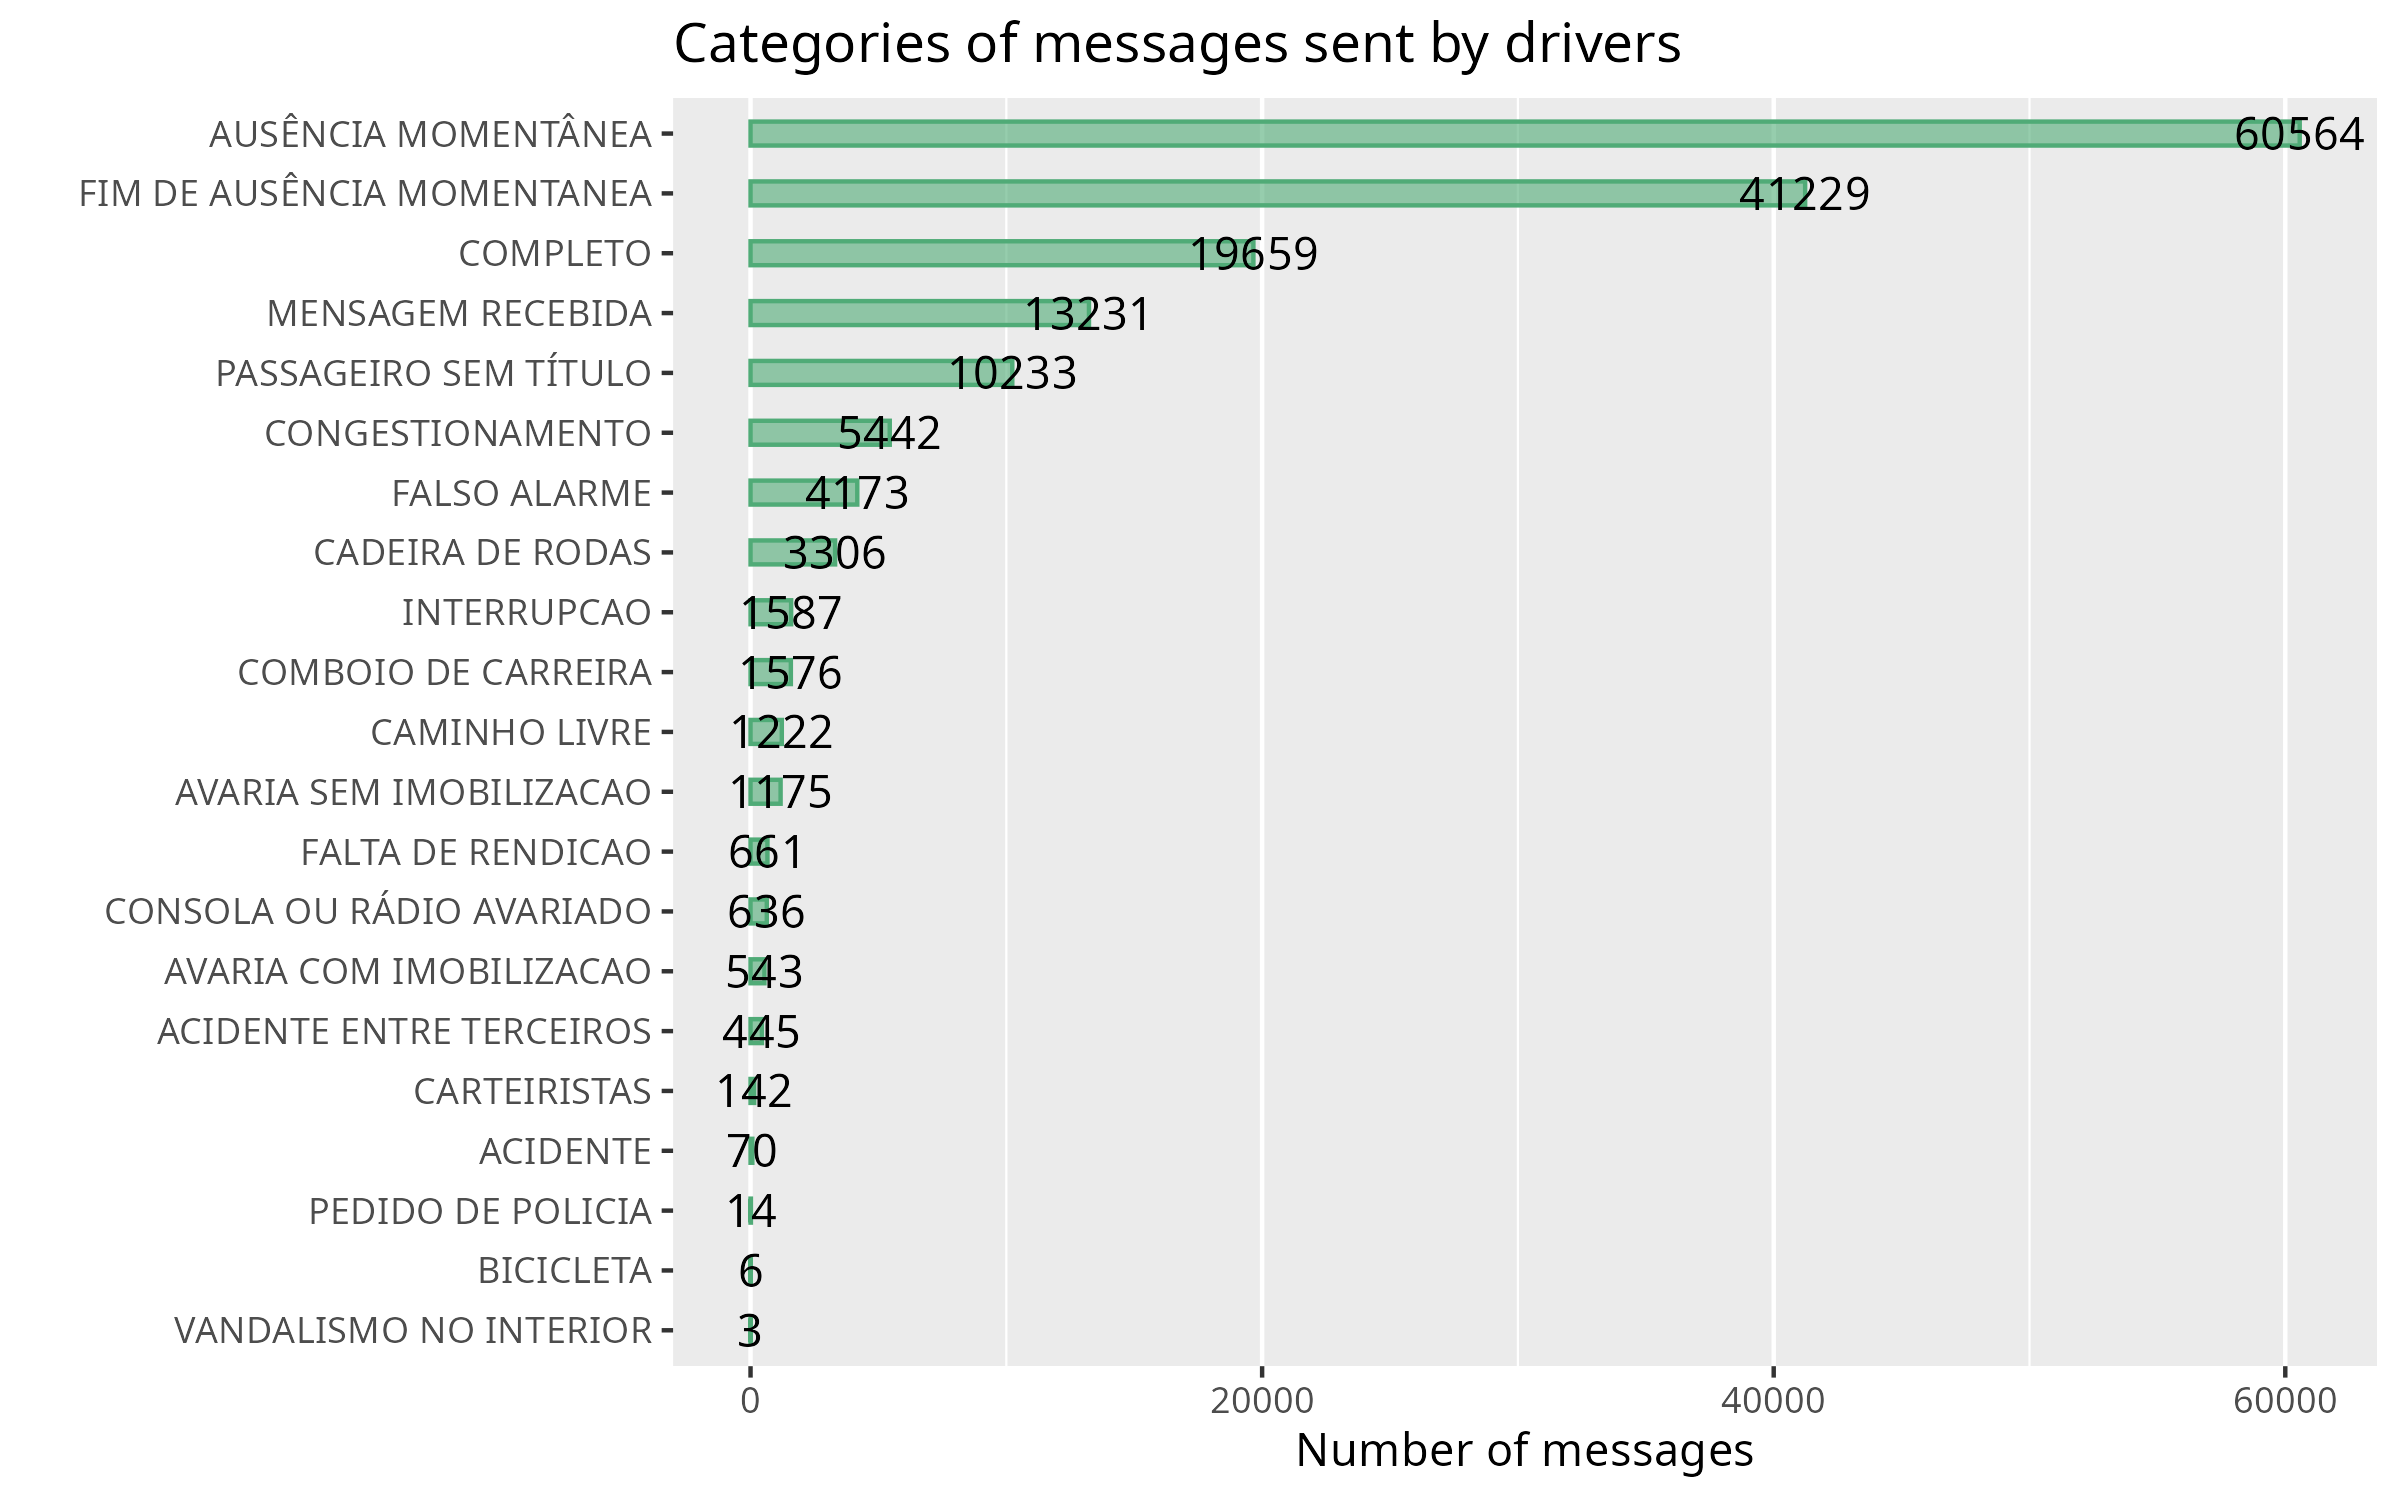
Descriptive stats
👥 Exchanged between drivers (61.4%) and controllers (38.6%)
👨✈️ Drivers
2.78 per day (SD = 2.35), on average
Mostly related to procedures (67.51%)
Descriptive stats
👥 Exchanged between drivers (61.4%) and controllers (38.6%)
👨✈️ Drivers
👮♀️ Controllers
Mainly free text messages (71.8%)
Descriptive stats
👥 Exchanged between drivers (61.4%) and controllers (38.6%)
👨✈️ Drivers
👮♀️ Controllers
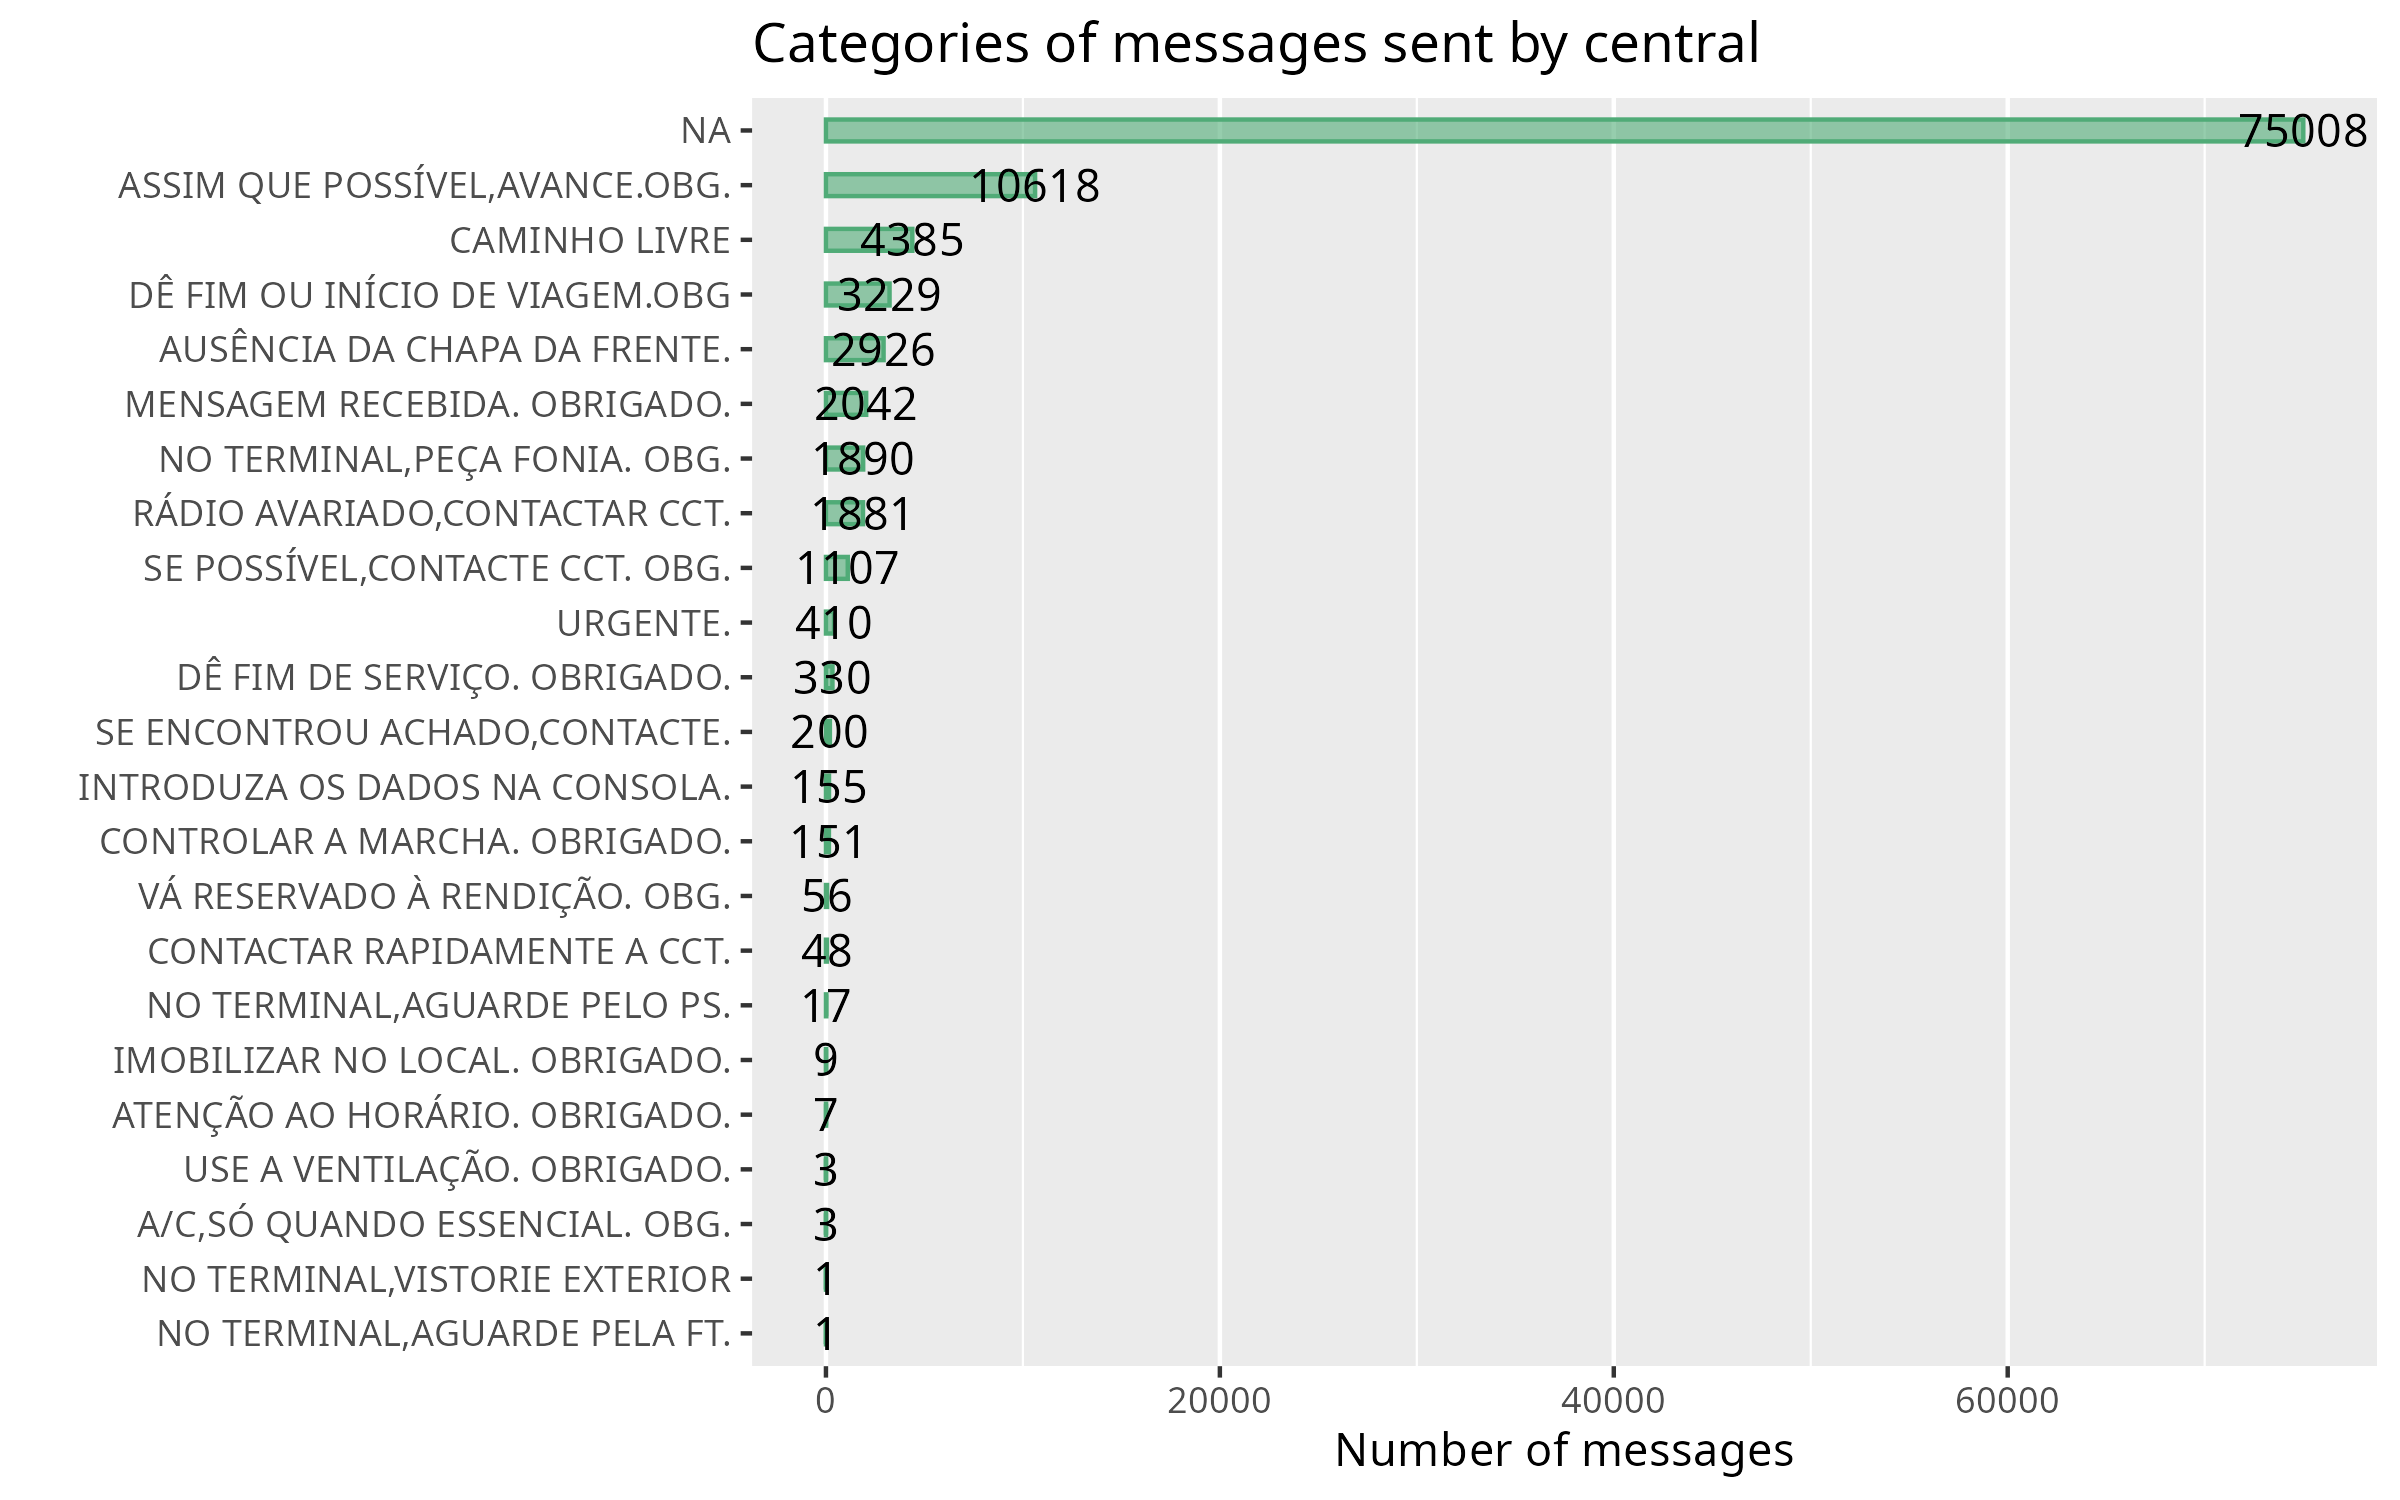
Problem: Information loss on controllers’ free text messages
Word frequency analysis
Useful to identify context specific and correct lemmas and stop words
1st iteration
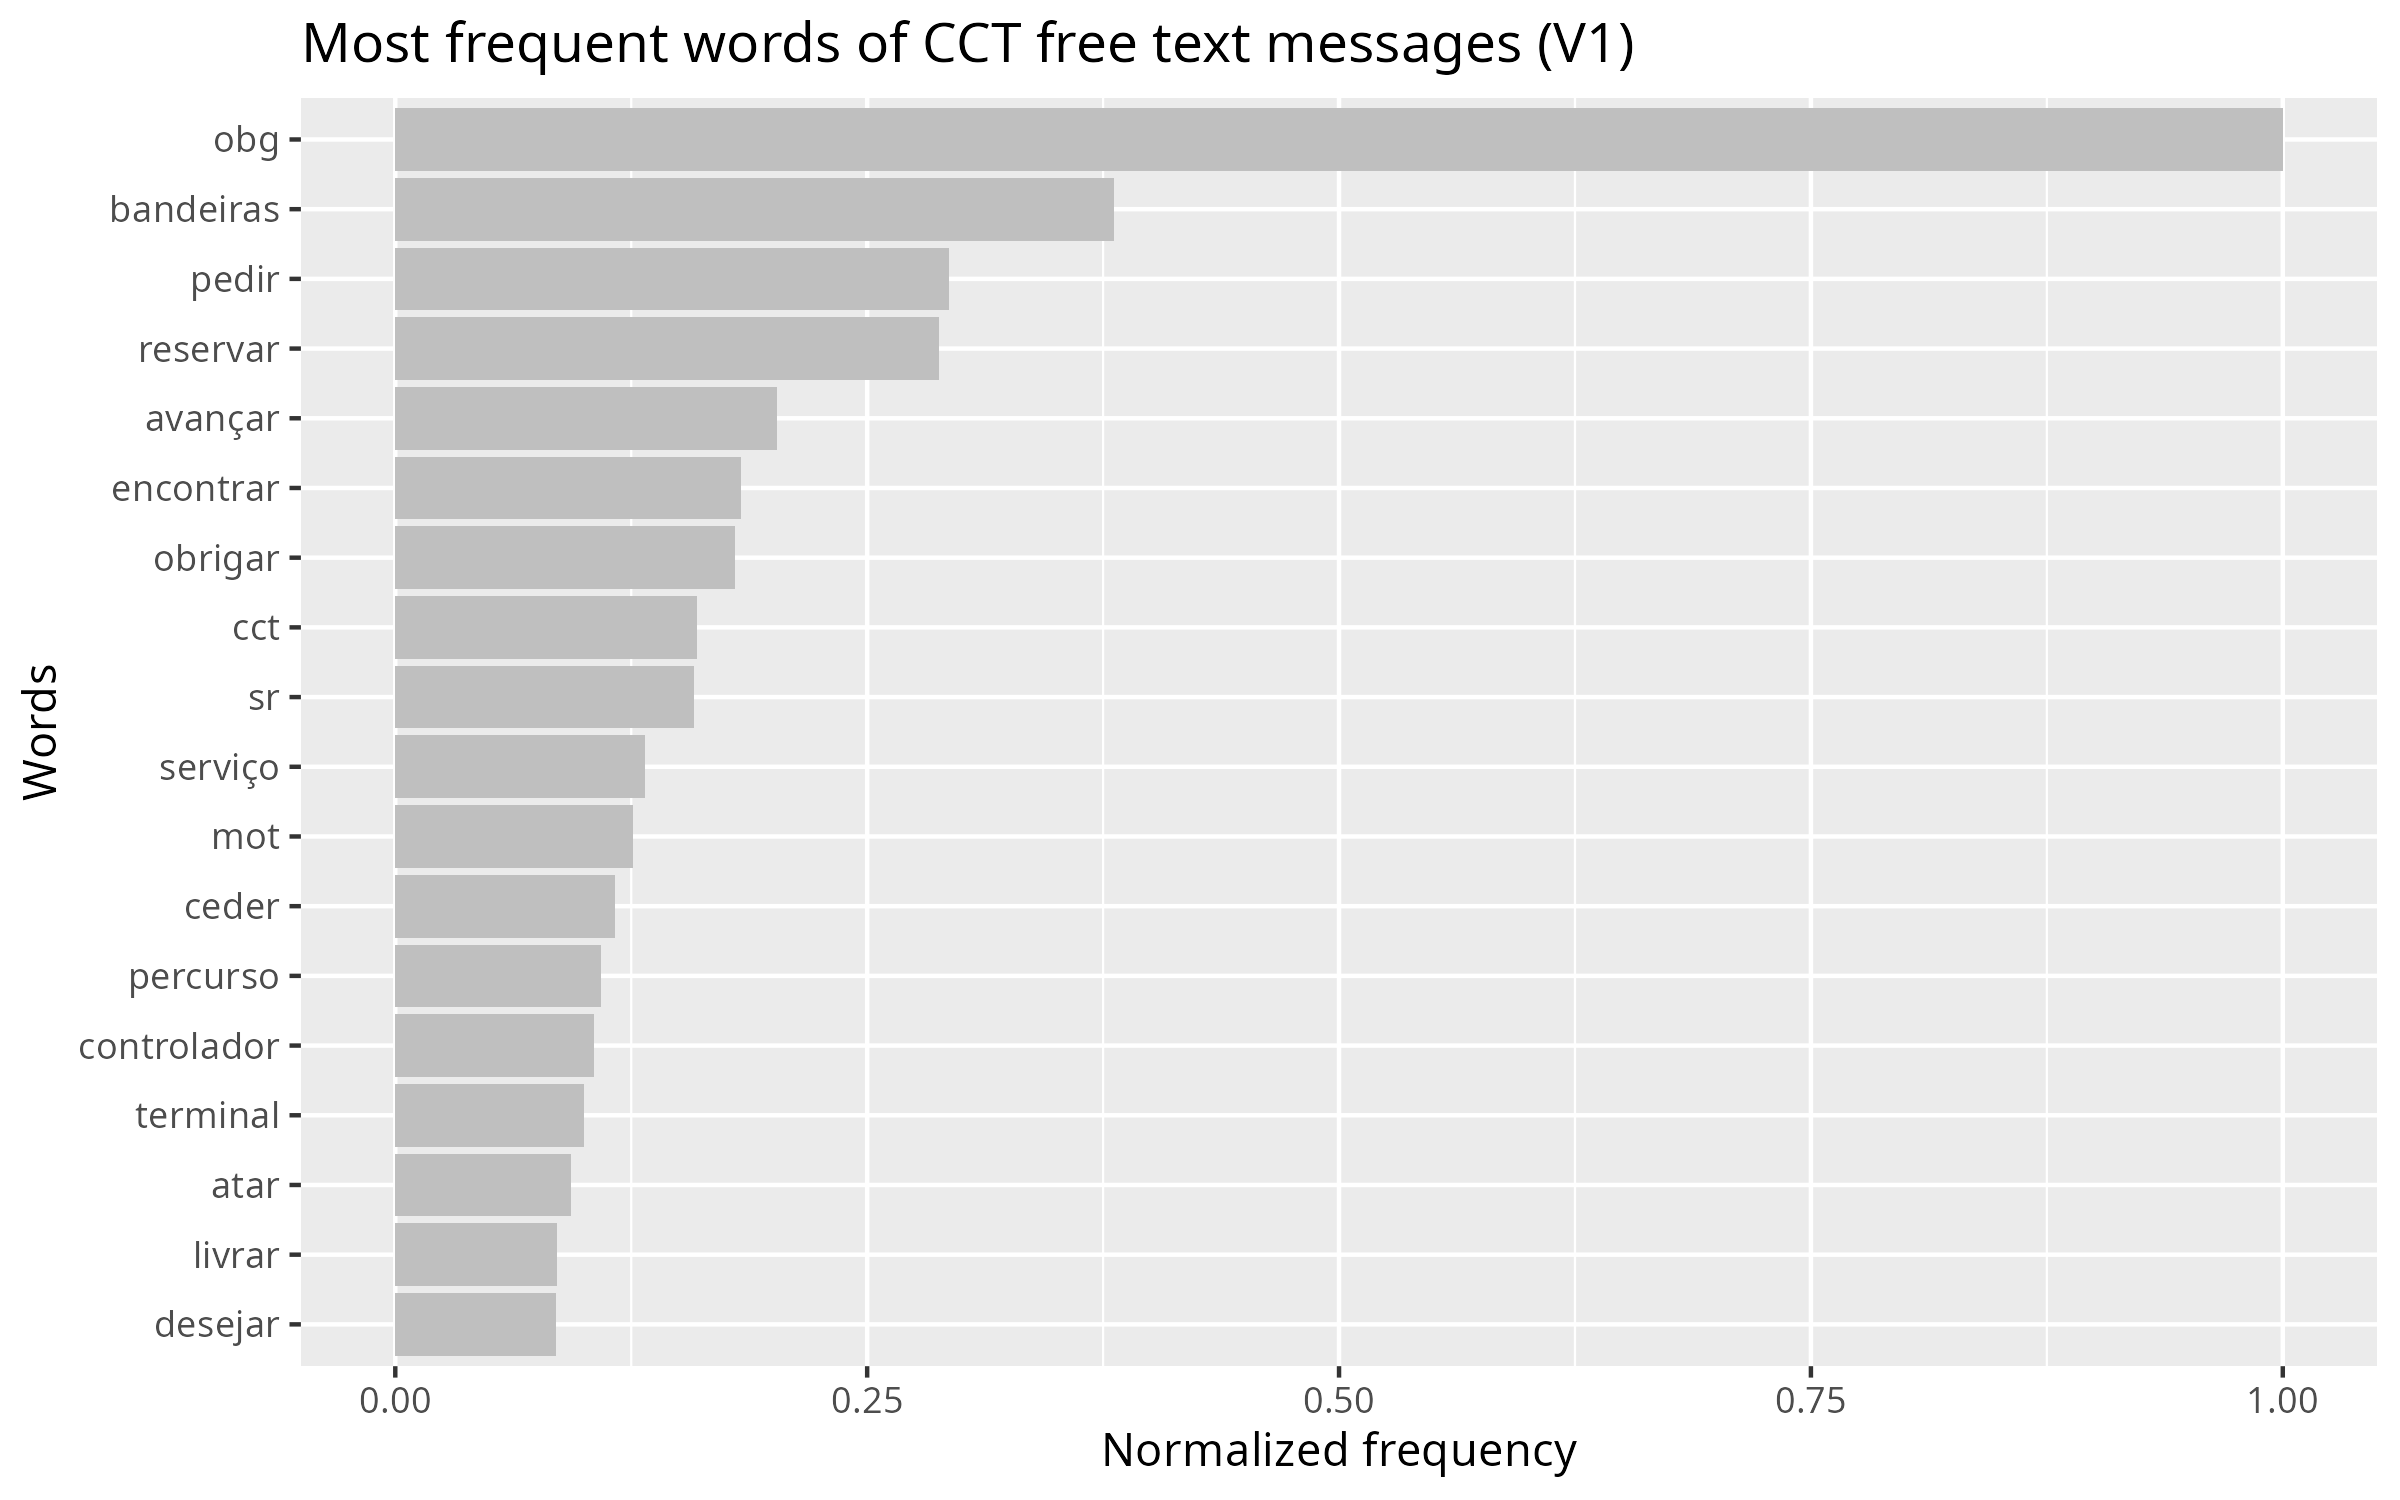
obg is a missing lemma (obrigado)
atar is an invalid lemma (até > atar)
pedir is an invalid lemma (pedido > pedir)
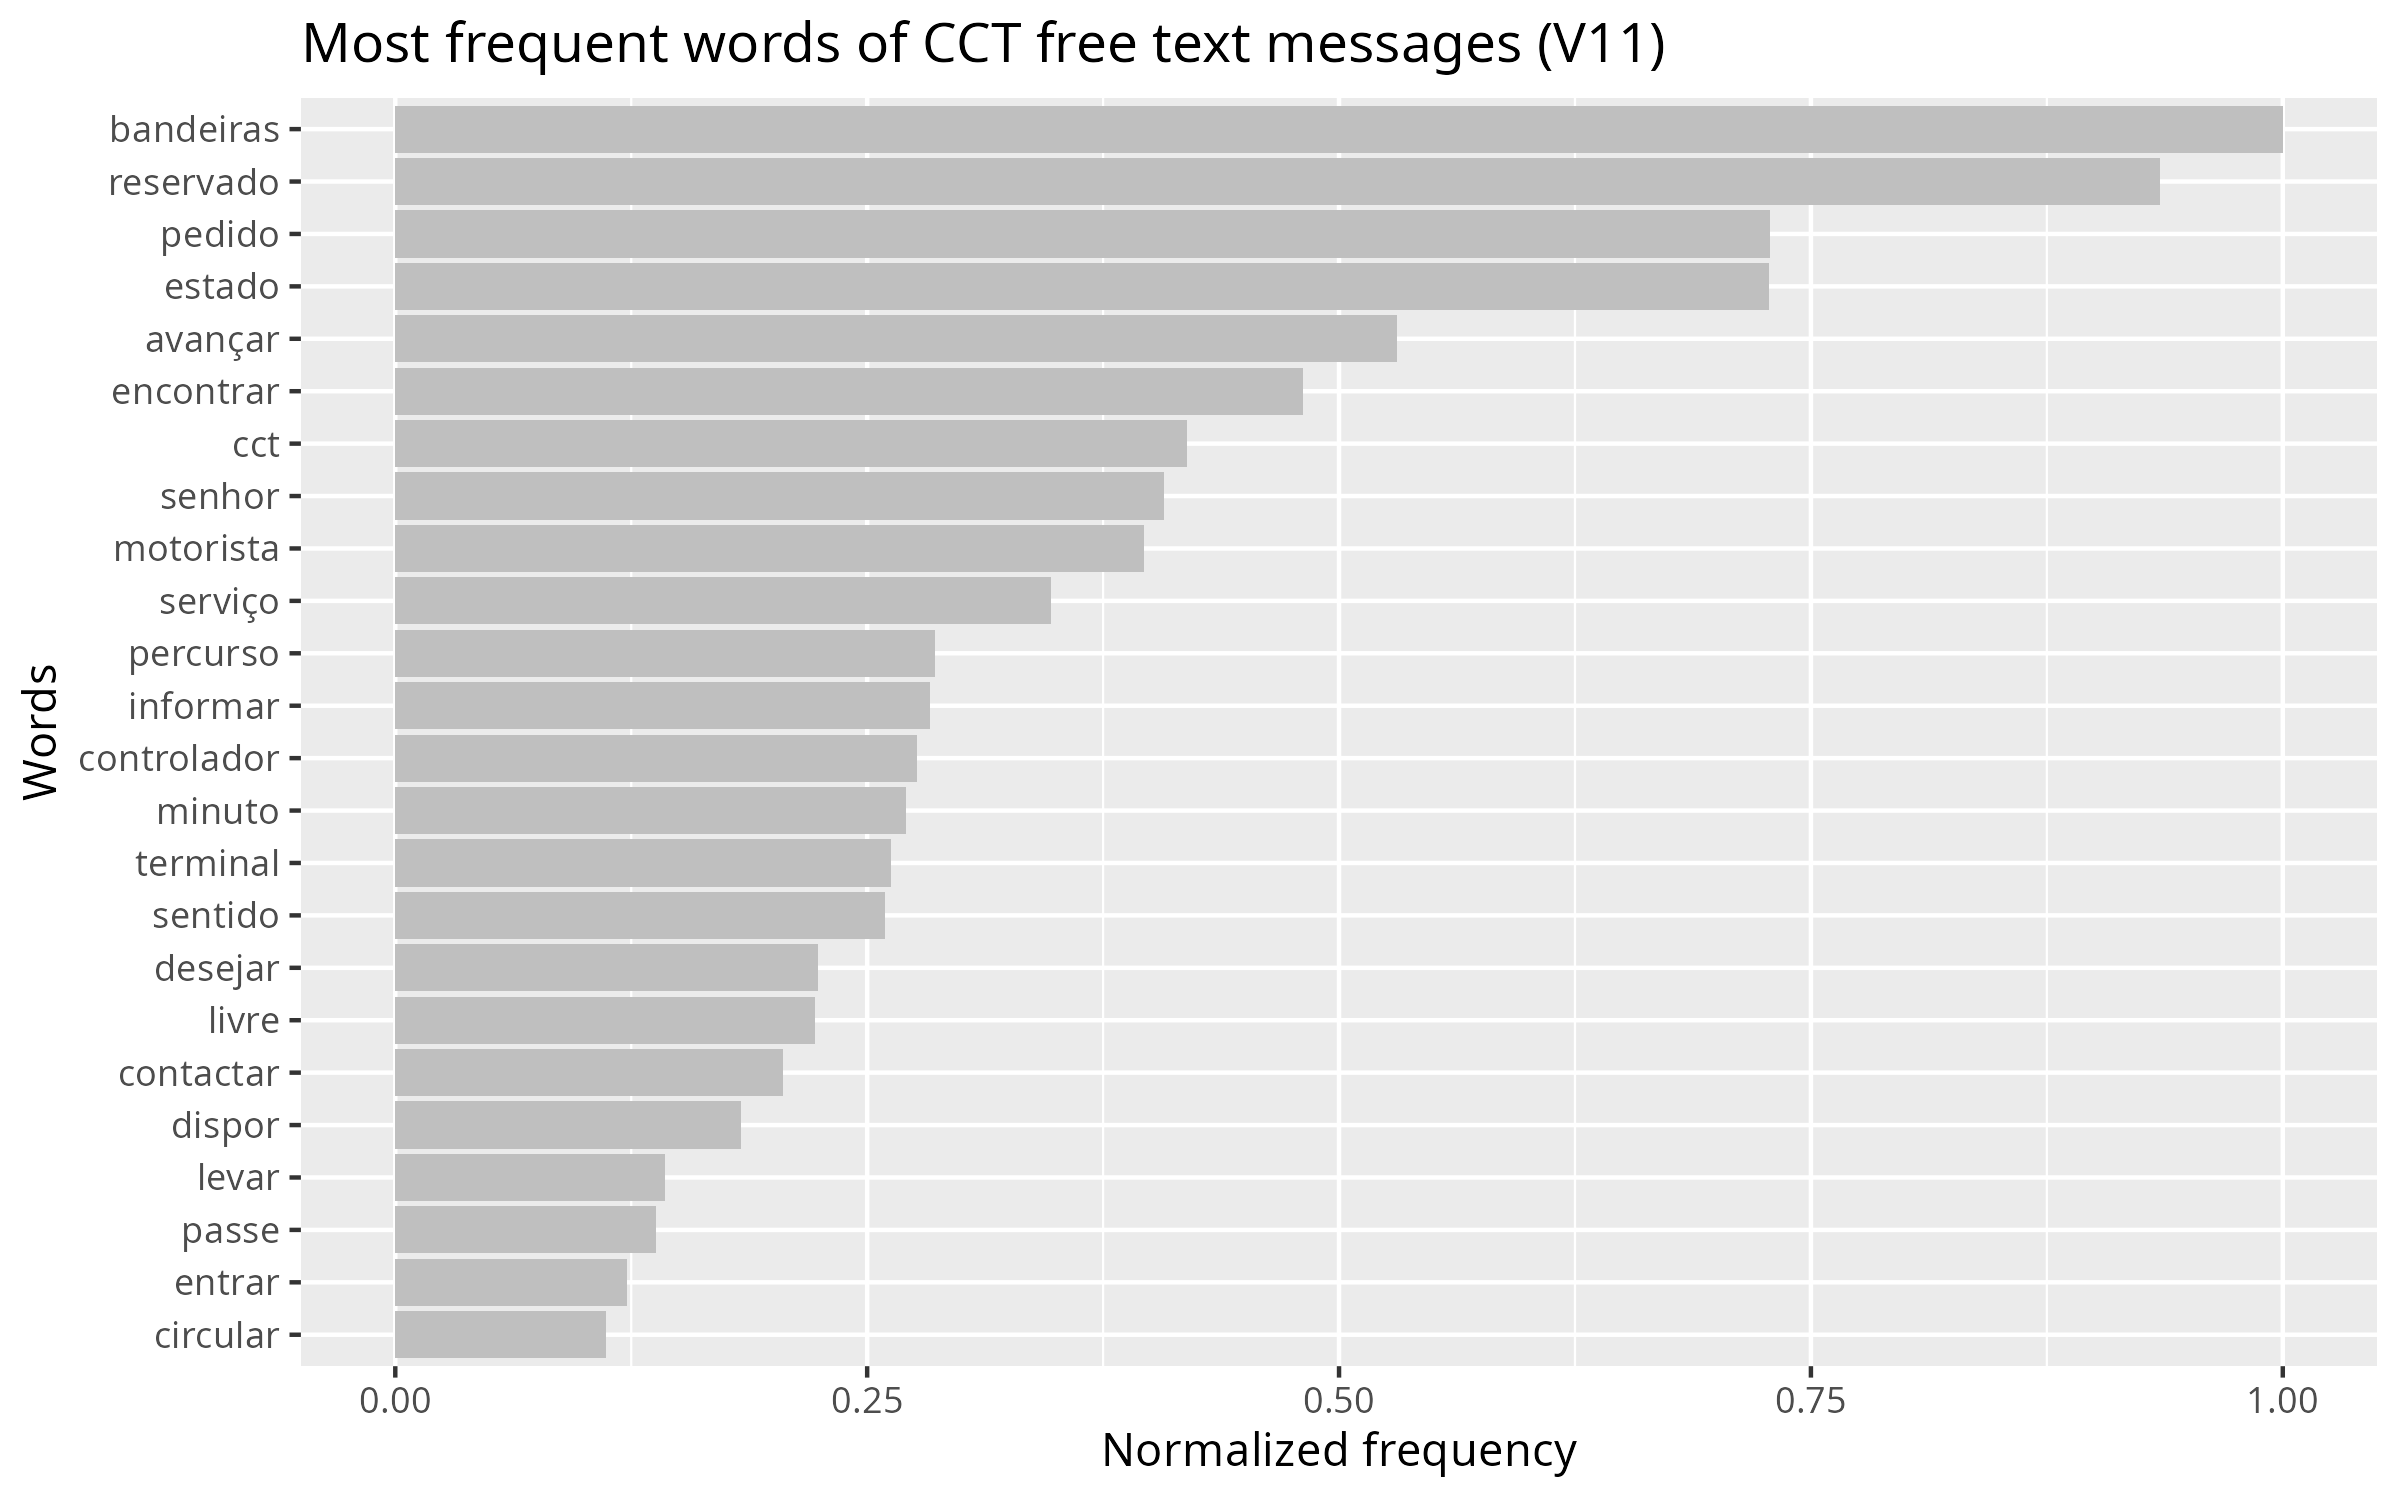
Word frequency analysis
Useful to identify context specific and correct lemmas and stop words
1st iteration
11th iteration
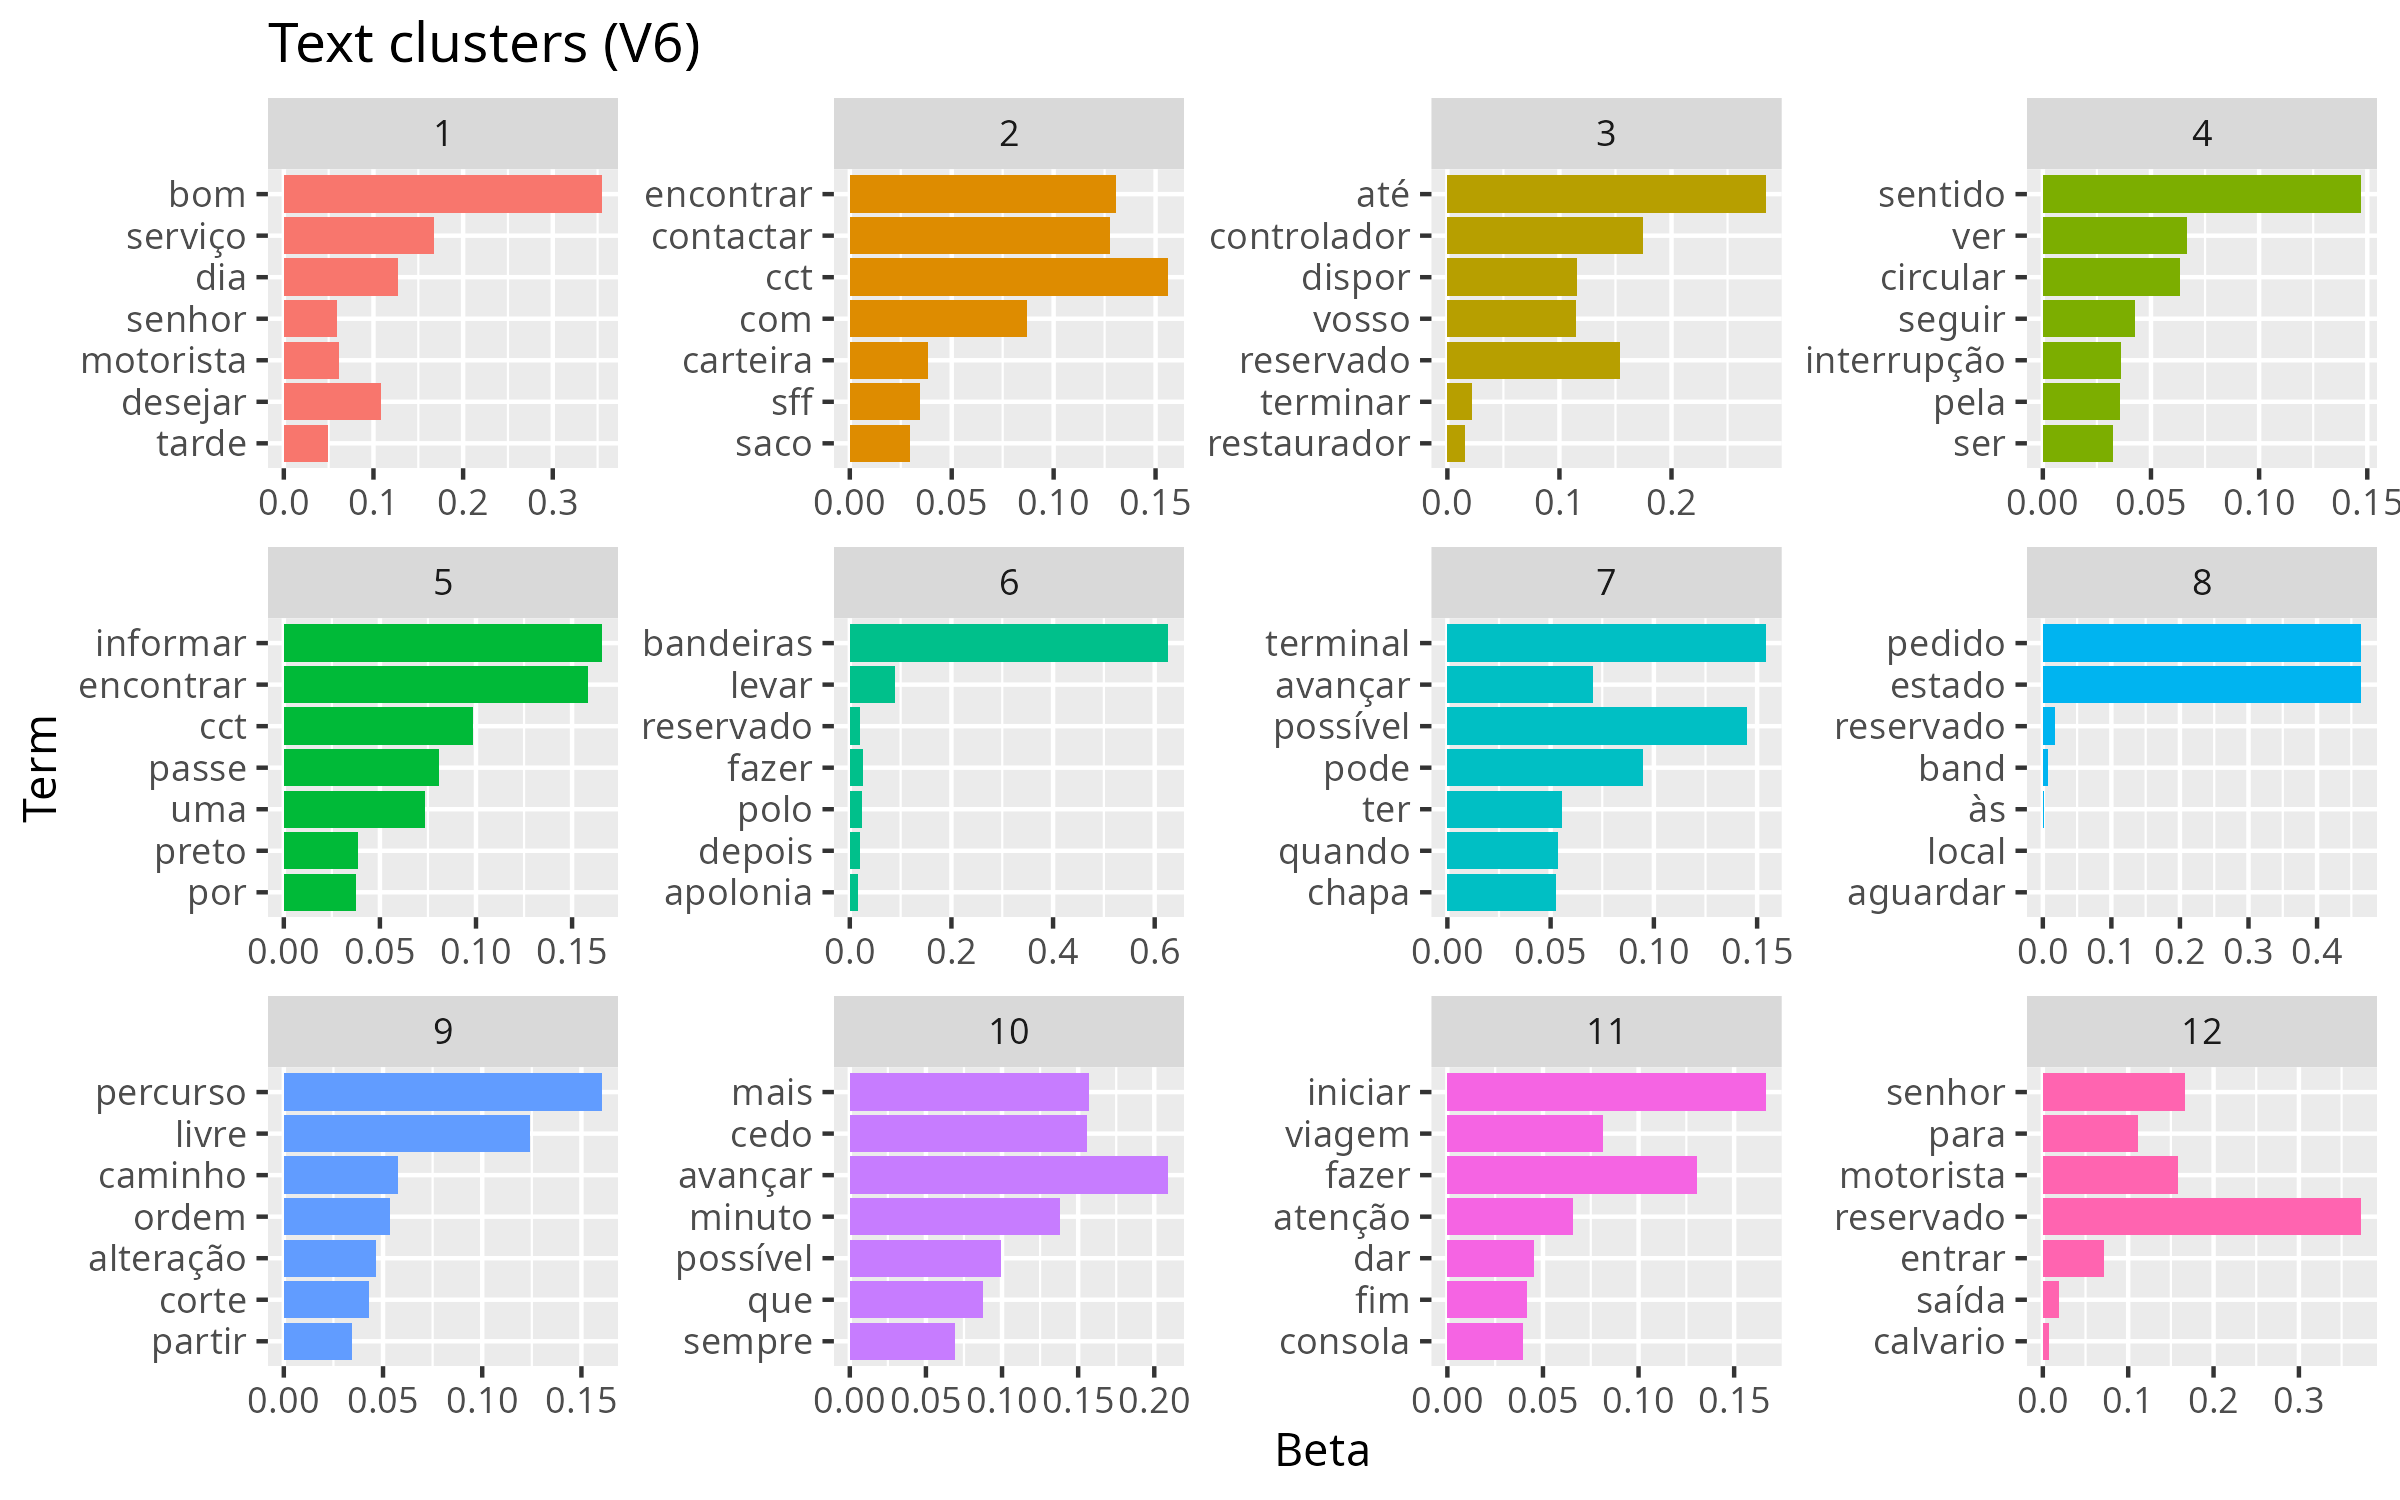
Topic modelling
Using Latent Dirichlet Allocation
Free text analysis outcomes
Before
75 008 uncategorized
71.8% of controllers’
27.8% of total
Free text analysis outcomes
Before
75 008 uncategorized
71.8% of controllers’
27.8% of total
After
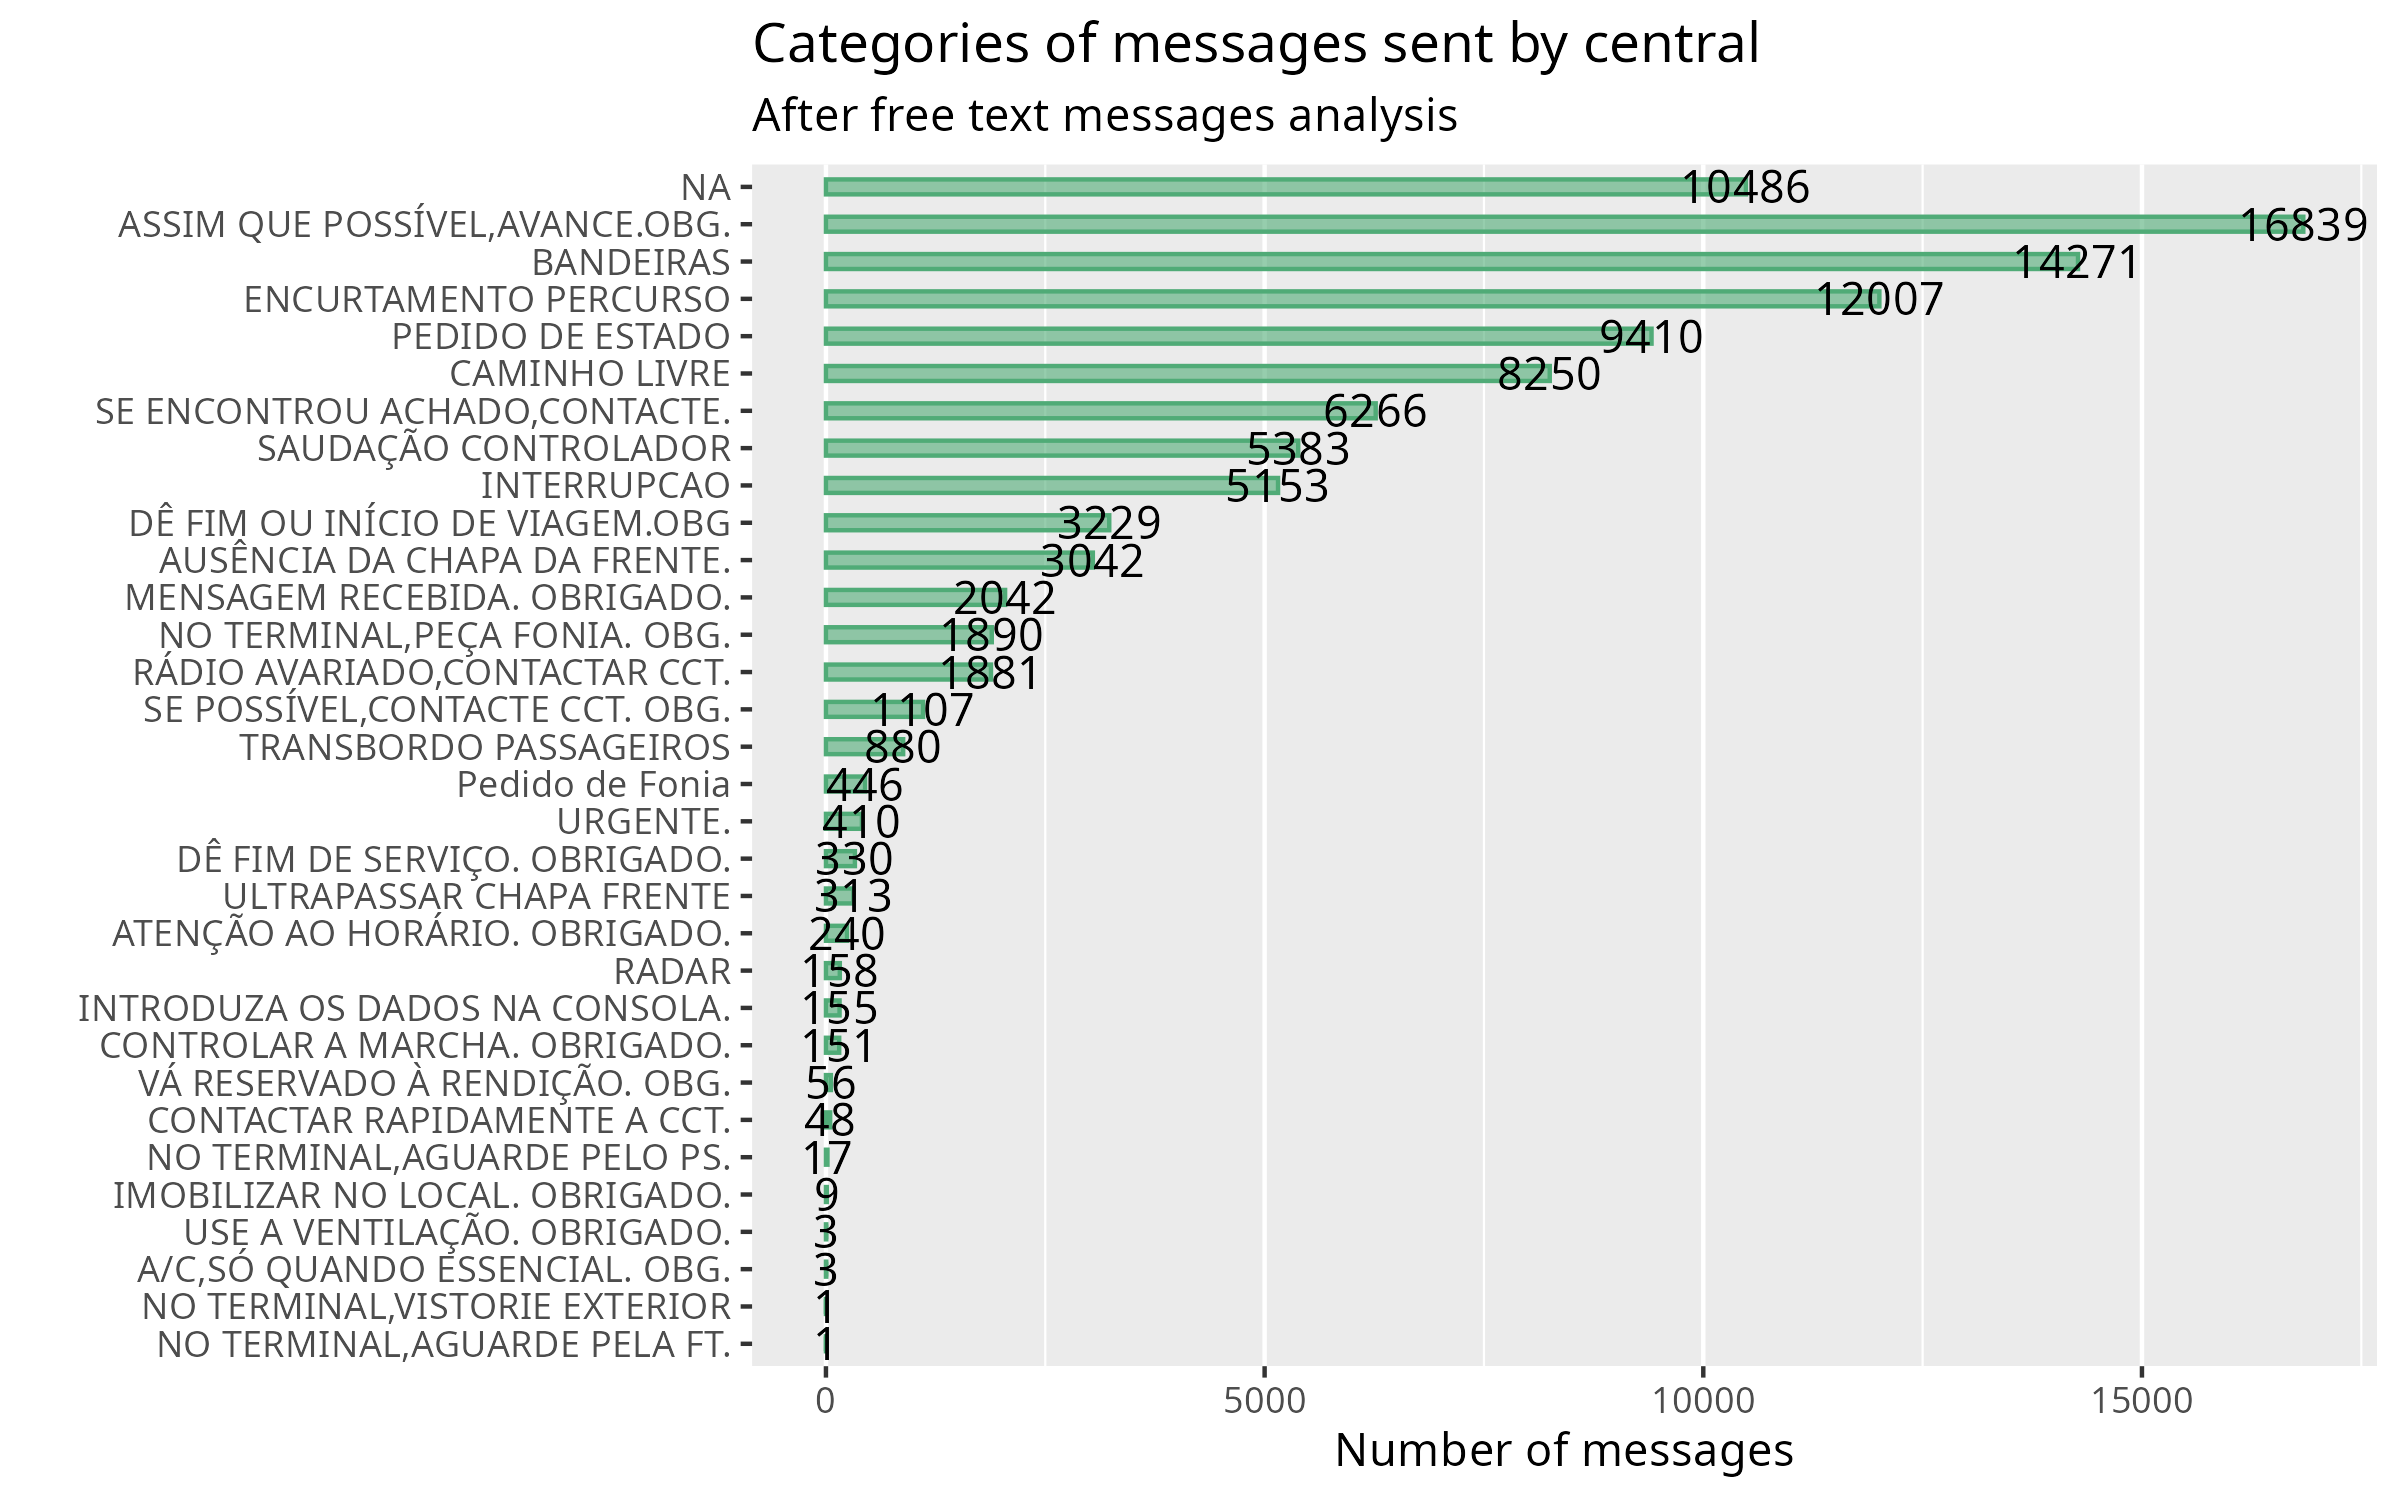
10 486 uncategorized
10% of controllers’
3.9% of total
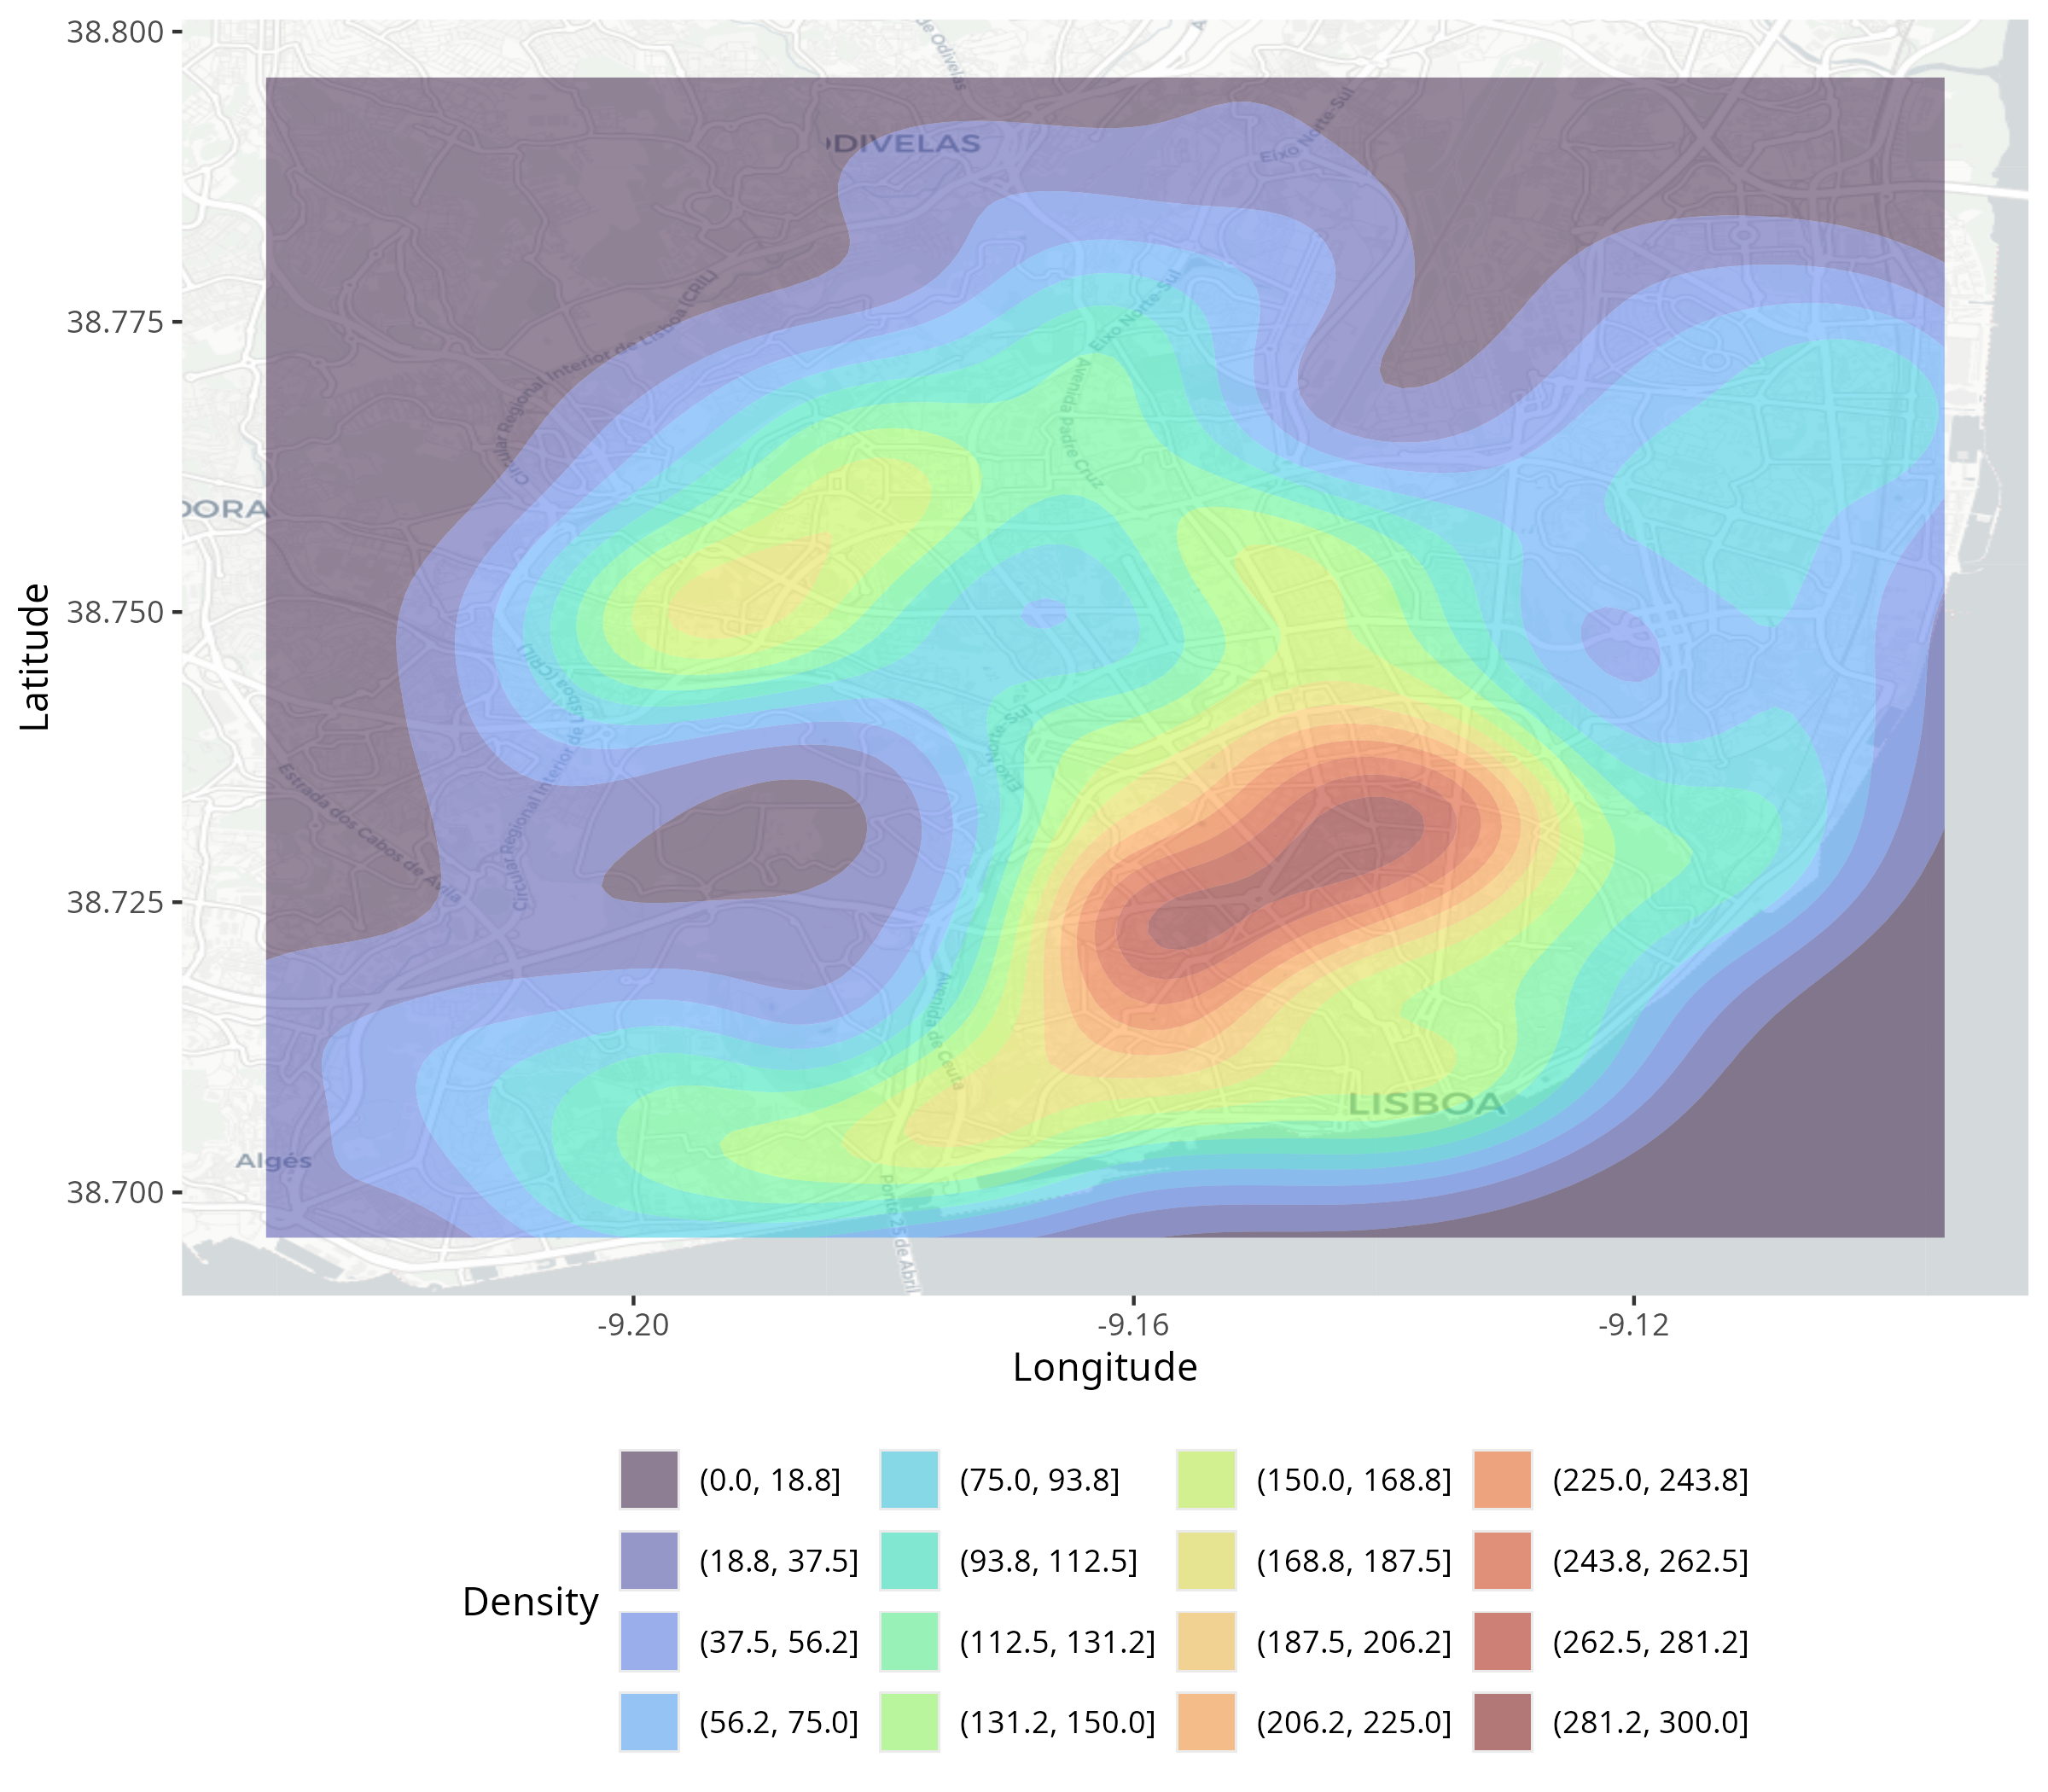
Messages spatial analysis
Kernel density maps (Wickham 2016)
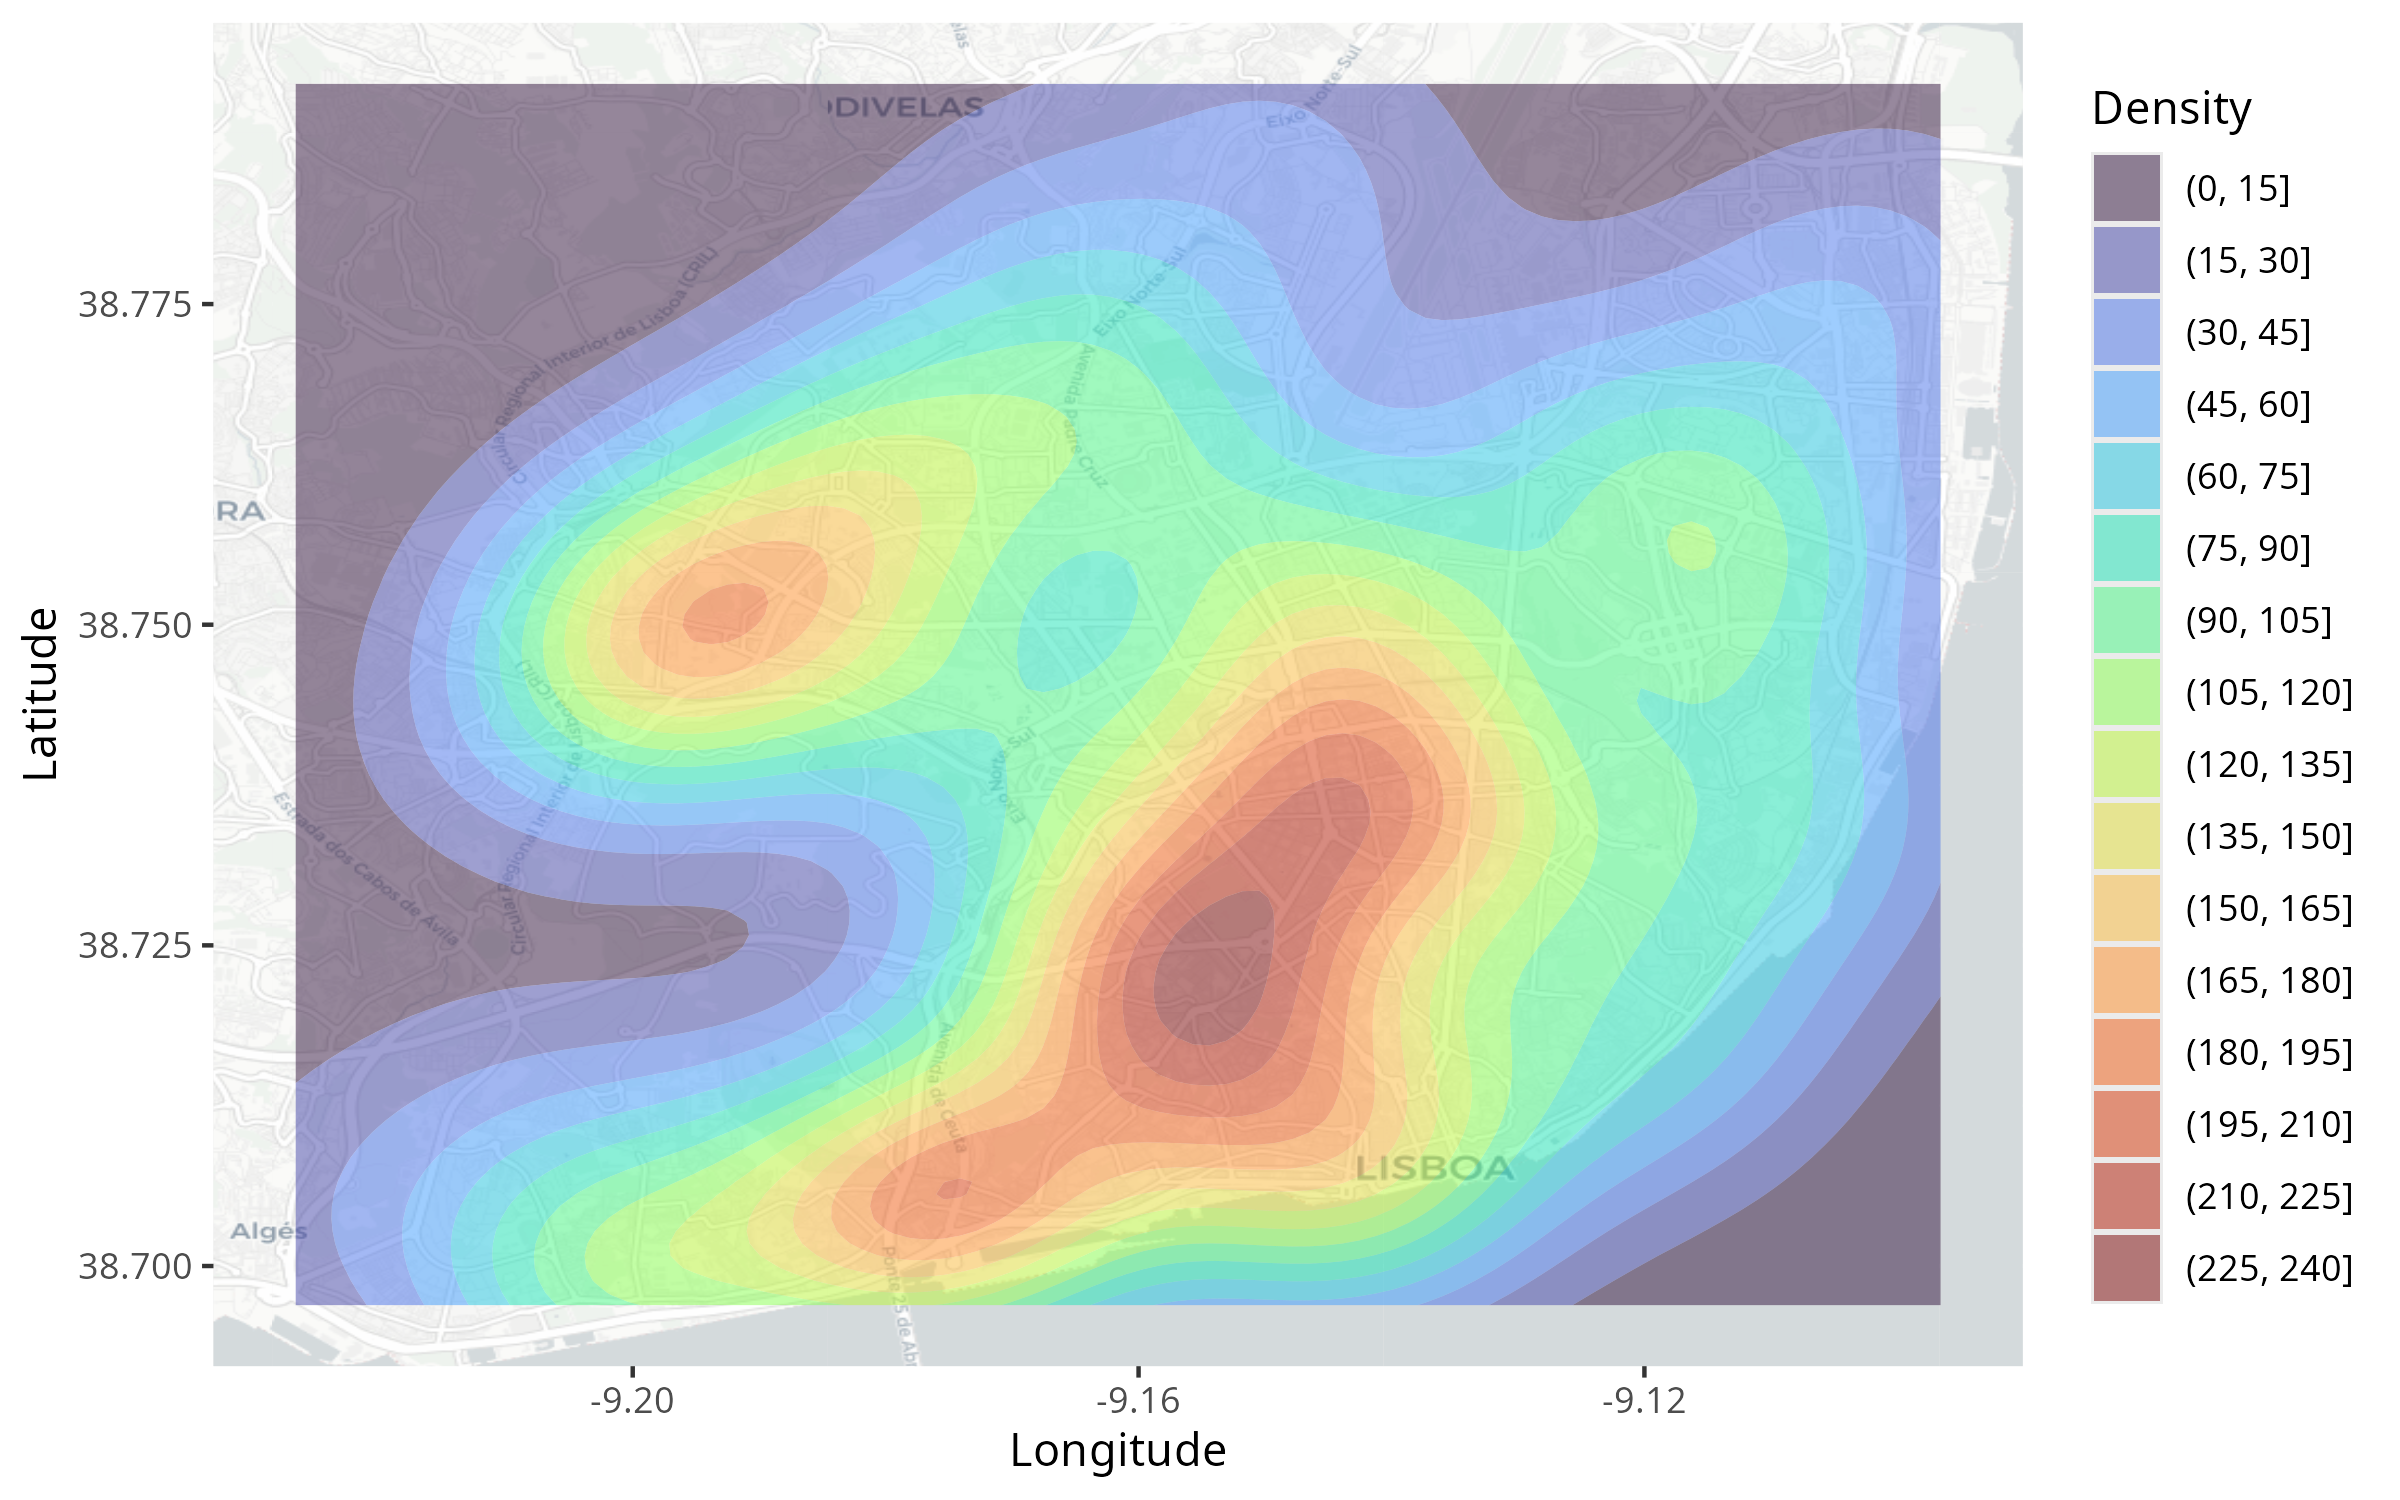
Messages allow to improve resources allocation
Useful for network and schedule planning
Messages allow to improve resources allocation
Useful for traffic controllers allocation
Messages allow to improve resources allocation
Useful for fraud controllers allocation
Messages complement events
Drivers’ inputs can complement the data-driven analysis
🚌🚌 Bus bunching example