From the Steering Wheel to the Planning Table
A Participatory Framework for Bus Network Monitoring and Planning
Bus transit services are essential to urban mobility, yet it experiences several operational challenges that must be addressed to ensure its efficiency and reliability. This paper focuses on this problem, trying to understand it from a perspective that has received little attention by the literature: those behing the steering wheel. It proposes a participatory, human-centered framework to integrate drivers’ insights into monitoring and planning processes. Semi-structured interviews with controllers from different cities provided an overview of the state-of-the-practice, followed by a case study of Lisbon’s bus operator, Carris. A focus group with bus drivers revealed their perceptions on performance, factors impacting it and improvement opportunities. Thematic and ranking analyses were conducted to identify their priorities and awareness across operational, tactical, and strategic planning dimensions. Results show that drivers hold valuable knowledge about systemic inefficiencies spanning all planning levels (such as unrealistic schedules, inadequate infrastructure or ineffective communication systems). Also, it shows that drivers prioritize tactical and strategic issues over day-to-day operational concerns. Findings indicate gaps in formal mechanisms for driver participation and feedback, suggesting opportunities to transform their experience into actionable organizational knowledge. The paper contributes with a methodological framework for leveraging driver insights in bus network monitoring and planning, promoting adaptive, inclusive, and resilient urban transport systems.
Transit policy, Transit network planning, Bus drivers, Stakeholder engagement, Carris
1 Introduction
Bus services play a central role in urban mobility systems, offering a simple, flexible and efficient mode of transport. Nevertheless, it experiences several operational challenges that must be addressed to ensure its efficiency and reliability (Vuchic 1999).
1.1 Research gap
This problem is well established in the literature, with several studies addressing it from different perspectives. However, these are mostly quantitative and performance-driven, relying on data collected from automated systems. While these approaches provide valuable insights into bus operations, they often overlook the human element, particularly the experience and knowledge of bus drivers.
1.2 Research question and objectives
Behind their wheel, highly aware or more abstracted from their functional activity, drivers witness the service provided by buses first-hand. Their field experience is constantly generating tacit knowledge about the operation, producing insights whose comprehension goes beyond computer systems (and their explicit data) used to monitor services and manage occurrences. Understanding and integrating this perspective is thus essential, leading to the central research question: “How can the driver’s knowledge be used to monitor and plan a bus network?”.
To answer it, this paper proposes a human-centered framework that aims to assess the extent to which this knowledge is currently integrated in decision-making processes and the potential benefits of its inclusion. It applies qualitative methods to examine the existing practices of driver involvement in the industry and explores drivers’ own perceptions of service performance, operational constraints and improvement opportunities.
2 Literature review
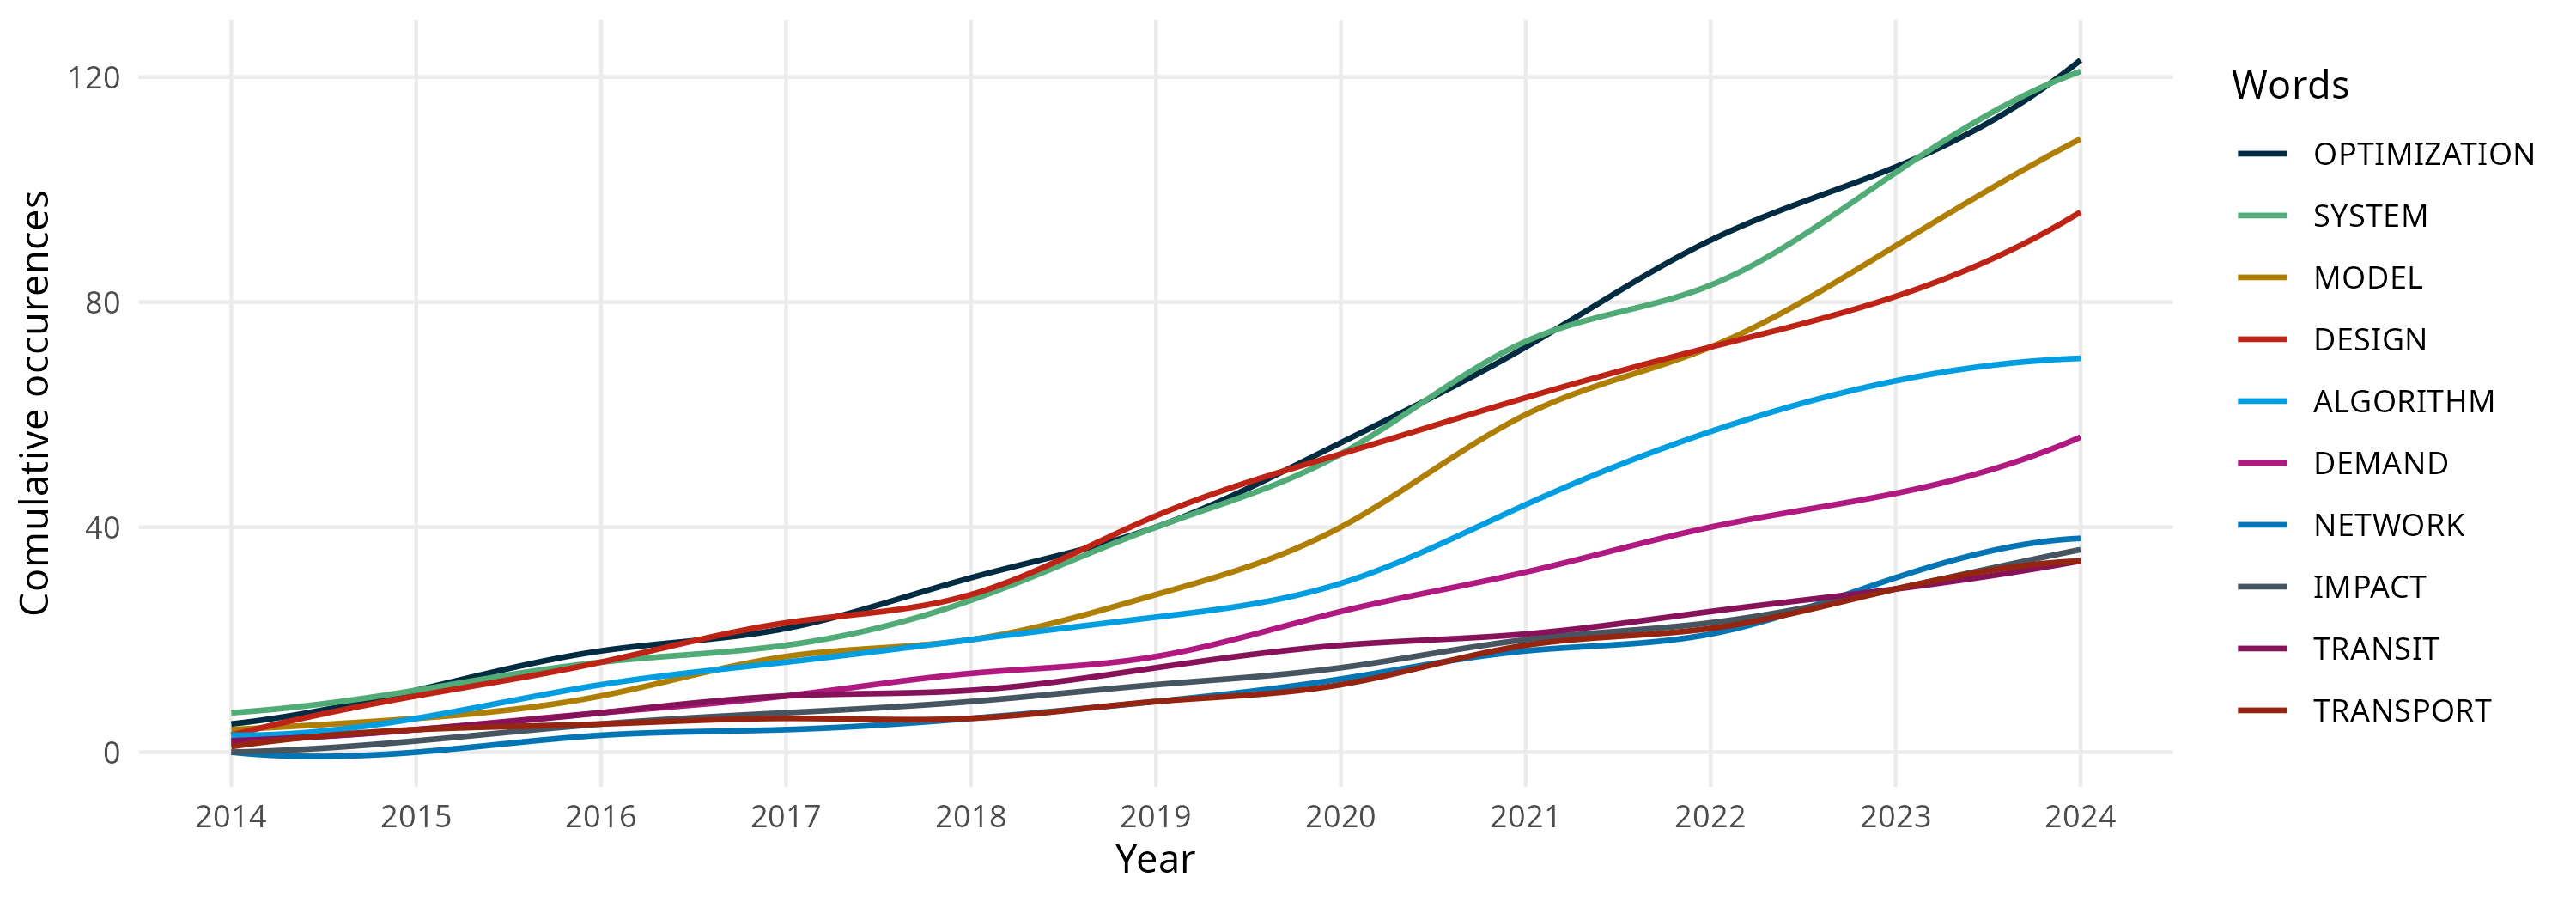
Bus network monitoring and planning is a relevant subject in the literature. Through a bibliometric analysis using Bibliometrix tool for R (Aria and Cuccurullo 2017) over a search on the Web Of Science database1, in the past 10 years, there are 960 papers reported about this subject, with an annual growth rate of 7.67%.
Over this period, several perspectives have been considered. When analyzing the cumulative occurrences of keywords on these papers (Figure 1), “system”, “design” and “optimization” stand out, suggesting the need to look at the network as a set of interconnected components that should be considered in an holistic approach, with a critical view over its features and characteristics, aiming for a constant improvement. A process that seems to be based on a quantitative and performance-driven approach, suggested by the consistent importance of the words “model” and “algorithm”. “Demand” is a word that seems also relevant, a driver for transportation planning, both a-priori to meet mobility needs, but also on the monitoring stage, influencing travel times and delays.
Drivers do not come up on this ranking, neither seem to be relevant on the title, abstract or keywords of many papers. When the previous search is extended to include the word “driver”, the results are narrowed to 12 papers. Nevertheless, they remain a key element of bus operation, bearing the ultimate responsibility for carrying out the planned services that together make up complete and interconnected transportation networks.
This literature review tries to understand to what extent they are studied by the scientific community and over which perspectives. Then, to establish some basis for the research question, it explores how bus networks are monitored and planned and what perspectives are included in this process. Finally, an overview of the factors that have been identified to potentially impact the operation is presented, to set a baseline for the study of the drivers inclusion on its supervision.
2.1 Drivers as the research focus
Research on bus drivers has traditionally centered on their wellbeing and performance, addressing factors such as fatigue, interpersonal relationships, and attitudes towards technological or contractual change. Despite their relevance, these consider drivers as an output of the system, facing their performance or cooperation as a result of the system’s design, rather than an input shaping it. Only a few studies have moved beyond this view, integrating driver perspectives into a framework for performance evaluation (Hassan, Hawas, and Ahmed 2013), transport policy (Cuevas, Niño, and Codina 2020) or network design (Cordera et al. 2024). Together they suggest that involving drivers in policy-making and planning of bus systems is beneficial (in line with Nakanishi and Kittelson & Associates, Inc (2003) practices on stakeholder acceptance), extending the scope of their role from mere operators to active contributors in the design and improvement of the service.
2.2 How is the network monitored and planned?
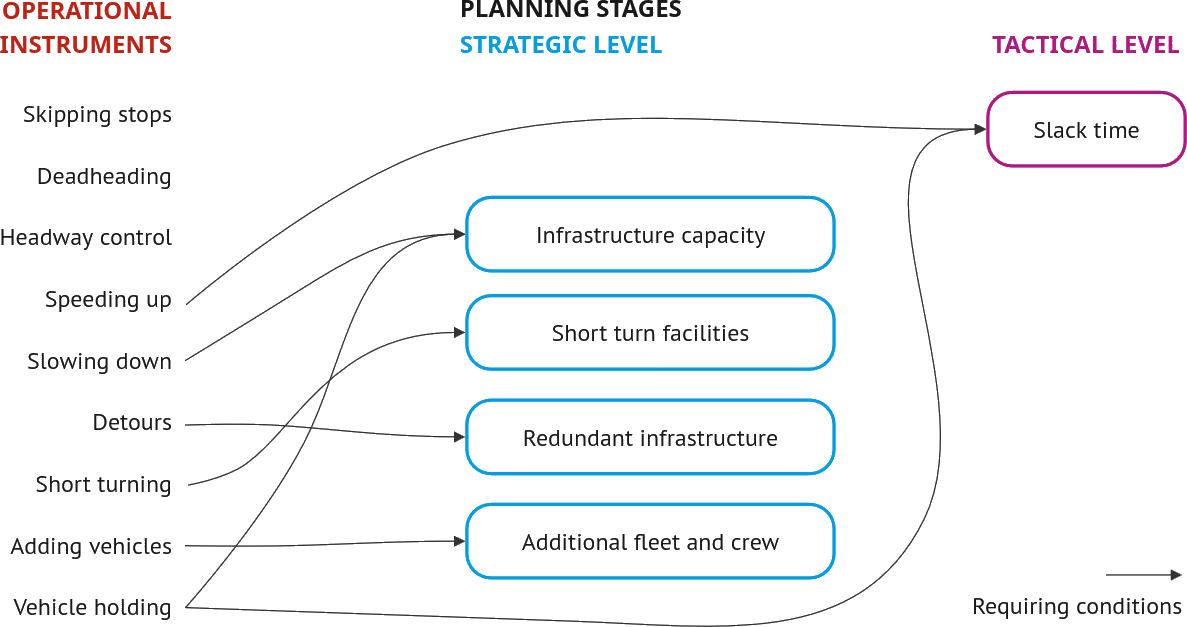
The monitoring and planning of bus networks covers several interdependent levels (strategic, tactical, operational), each with distinct but connected goals (Desaulniers and Hickman 2007). If on the one hand handling disturbances to ensure the service reliability requires instruments that must have been endowed in previous planning phases (Figure 2), on the other hand, this provision requires continuous feedforward and feedback loops, that are usually fed with measurements and indicators (Nakanishi and Kittelson & Associates, Inc 2003). Yet, to be truly effective, such monitoring must go beyond explicit, data-driven measures and incorporate the tacit knowledge gained from daily operational experience. As Halonen and Laukkanen (2008) and Rumanti et al. (2019) argue, the interaction between tacit and explicit knowledge enhances organizational learning and innovation. Governance and stakeholder engagement (Cambra 2012) are also essential to embed this learning into institutional practice.
2.3 What is impacting the operation?
Bus operation takes place inside a complex and dynamic urban system influenced by numerous internal and external factors (Desaulniers and Hickman 2007). Internal elements such as service planning, vehicles, stop design and operation, bus lanes, drivers and urban environment shape service reliability and efficiency (Cordera et al. 2024). Operational outcomes are also further affected by external conditions, like weather, conflicts with traffic and passenger demand variability (Van Oort 2011). Understanding these interactions is essential for effective planning, as it enables agencies to anticipate and mitigate negative impacts while enhancing supportive ones. Differentiating between endogenous and exogenous influences also helps clarify where operators or authorities can intervene most effectively.
3 Methodology
After establishing the theoretical framework with the literature review, the authors carried out several interviews with relevant actors in the operational control of bus services in several cities to complement the theory with practical insights about the state-of-the-practice of driver involvement in the industry. Then, a case study of urban bus operation was selected, to target drivers perceptions of service performance, operational constraints and improvement opportunities. This exploration was conducted through a focus group dynamic, enabling an in-depth exploration of their own experiences and knowledge. Finally, the several outputs were discussed and synthesized to answer the research question of how can the driver’s knowledge be used to assist in the monitoring and planning of a bus network.
3.1 State-of-the-practice
To complement the literature review and address the limited evidence of drivers’ involvement in bus service monitoring and planning, a series of structured interviews was conducted with professionals responsible for operational control in different cities. Using a convenience sampling approach, 13 professionals from several countries were contacted via LinkedIn and personal networks, resulting in four completed interviews. Conducted remotely, each session lasted between 30 and 60 minutes and explored three key topics: drivers’ communication with control teams, their participation in operational decision-making and their involvement in network design and planning. The interviews provided valuable benchmarking insights and informed the development of the subsequent case study.
3.2 Case study
The case study focus on Carris, the public bus operator of Lisbon, which serves Portugal’s largest city (545,796 inhabitants; INE (2021)). It is part of a dense and multimodal metropolitan transport network, built up on rail, fluvial and road services integrated under the Navegante ticketing system. Carris operates 102 routes spanning 757 km that serve the city and connects it to the surrounding municipalities. It employs 1,658 drivers and runs 777 buses that deliver nearly 34 million vehicle*kilometres annually (Carris 2024a, 2024b). With an average of 516,000 passengers per weekday and over 100 million per year (Carris 2023), the service is mostly used by frequent users, reflecting its central role in the city’s mobility system (Carris 2024b). Despite this extensive coverage, the company faces growing challenges caused by congestion, construction works and conflicts with private vehicles (Carris 2024b) that have contributed to the reduction of its commercial speed to 13.71 km/h, the lowest in two decades, which raised concerns about the system’s reliability and resilience (Alemão 2025; Soldado 2024).
3.3 Focus group method and analysis
To explore how drivers perceive bus service performance and how their tacit knowledge can inform monitoring and planning, a focus group was conducted. This qualitative approach enabled in-depth discussion of operational challenges and improvement opportunities while benefiting from group dynamics that encouraged debate and spontaneous insights (Bryman 2012; Tracy 2013).
3.3.1 Sample characteristics
Participants were selected by the operator to ensure diversity across gender, seniority, garage posting, and service type, representing different operational contexts. The session was carried out with eight drivers, with an average age of 42.4 years (SD = 4.57), 25% of which were women. Regarding the operational characteristics, each had worked at the company for 6.9 years (SD = 7.28) on average, covering all operator garages (3 from Alta de Lisboa, 2 from Miraflores and 2 from Pontinha). The variability of the services undertaken was also assured, since 80% of the drivers were contract workers, which, unlike permanent ones, are not assigned to a specific route, covering several services and schedules.
3.3.2 Location and moderation
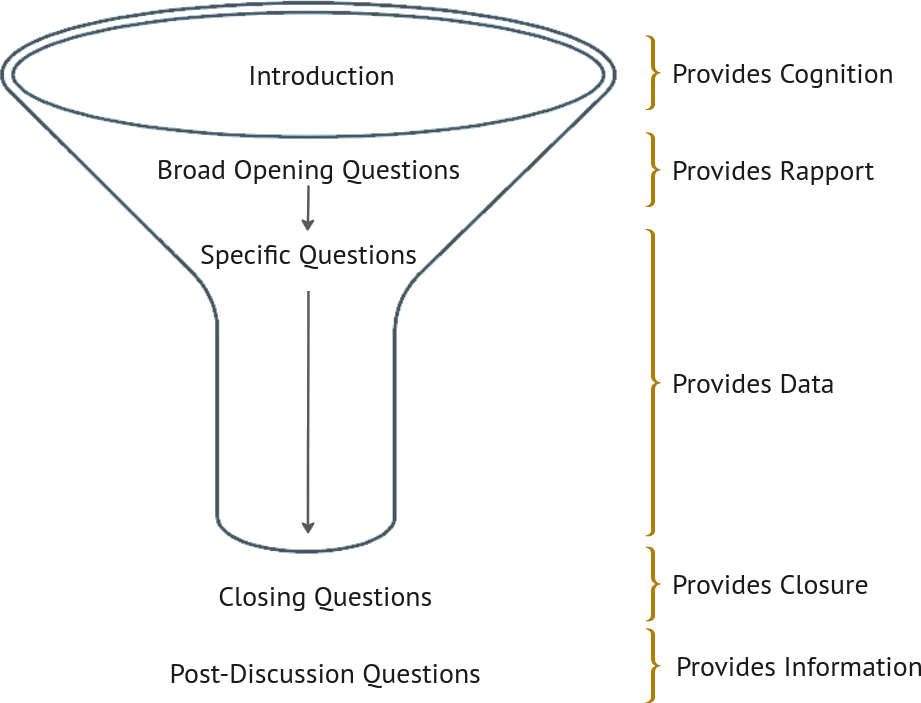
The session was held at the Pontinha garage in June 2025 and lasted 90 minutes. Moderated by the researcher, it followed a semi-structured discussion guide designed in line with Hennink, Hutter, and Bailey (2020) funnel design. This method, illustrated by Figure 3, begins with introductory questions to build rapport, followed by exploratory discussions on performance, influencing factors and use of the on-board monitoring system. Albeit the script, the purpose was to foster discussion and to let it flow naturally, with an active listening posture, bouncing between passive listening to the group interactions and active questioning to follow-up on emerging topics or refocus the conversation when participants start to diverge (Hennink, Hutter, and Bailey 2020).
Additionally, before closing, participants were asked to rank eleven operational factors that emerged during the session by importance, providing a quantitative measure to complement the qualitative outcomes, enabling a clearer prioritization of the issues discussed.
3.3.3 Data analysis
The recorded session was transcribed, coded, and analysed thematically by the authors, with the assistance of requal (Hladík et al. 2024) software for R, following Braun and Clarke (2006) Thematic Analysis framework. Themes were developed iteratively by the authors. After an immersive reading process, initial codes were identified both deductively, referencing known operational factors, and inductively, identifying new issues raised by drivers. Afterwards, themes are developed, grouping the codes into broader categories, that combine a coherent aggregation (internal homogeneity) together with a clear and identifiable distinction between different themes (external heterogeneity). This process, exemplified in Table 1, enabled the structured organization and interpretation of the session outcomes.
| Relevant text | Main idea | Code | Category |
|---|---|---|---|
| “…Ride-hailing was supposed to bring mobility, but it turned out to be the opposite. […] They are always at the bus stops. And that adds to the journey time…” | Ride-hailing causes delays | Conflicts with other vehicles | External Factors |
| “…For more than 15 years, the timetables have not been updated in line with the development of the city….” | Outdated timetables | Network design | Strategic Planning |
To complement these findings, the drivers’ factor rankings were statistically examined using Kendall’s Coefficient of Concordance (Kendall 1990) to assess agreement, and Borda Count (Borda 1781) to quantify relative importance. Together, the thematic and ranking analyses offered a comprehensive view of how drivers conceptualize operational performance and prioritize the factors influencing it.
4 Findings
4.1 State-of-the-practice
The interviews to assess how bus drivers are involved in service monitoring and planning were conducted with operational controllers from four cities: Lisbon, Porto and Braga in Portugal, and Portland, in the United States of America. All but Braga use on-board systems that allow drivers to report predefined events, complemented by radio or text communications. However, engagement levels differ. Portland exhibits the most comprehensive setup, with around 100 typified events and high driver participation, while Braga relies solely on mobile phone calls. Across all cases, prior driving experience is valued to become a controller, yet formal mechanisms to include drivers in operational decision-making are not globally established. Only Lisbon and Portland reported structured participation, whereas in Porto and Braga, involvement depends on controllers’ individual initiative. Feedback to drivers is virtually absent in the Portuguese cities, but well established in Portland, where an internal portal shares network performance statistics, creating a feedback loop that sustains driver engagement.
When addressing network design and planning, none of the operators reported to include drivers directly in planning teams, although most maintain channels for input. Portland again stands out with its long-running “yellow card” initiative, enabling drivers to submit suggestions reviewed individually by planners. Only Lisbon and Portland apply data-driven approaches to network design.
Overall, the benchmarking shows that while drivers’ experience is recognized as valuable, the structured inclusion of their knowledge in monitoring and planning remains limited in Portugal.
4.2 Focus group thematic analysis
The focus group analysis resulted in 18 codes, grouped in six categories, covering the operational goals definition and the internal and external factors that direct or indirectly influence it. The internal factors were, in turn, split through the several stages of network (strategic and tactical) planning and (operational) management due to their wide coverage of the planning process. Finally, the sixth code emerged from the drivers self-consciousness reporting during the session, regarding themselves, the company and the operation.
4.2.1 Operational goals
Drivers define good performance as connecting every passenger from A to B on time, with comfort, safety and no complaints. However, they highlighted that these goals often conflict. For example, driving gently for comfort can hamper punctuality, while strict on-time running can reduce recovery time. The group perceives a misalignment between field realities and the company expectations, noting the absence of clear guidance on how to balance competing objectives when trade-offs are unavoidable.
“Because maybe, if we fulfil what we think is a good service, maybe we’ll delay our journey for X amount of time, and then, for Carris, maybe it’s no longer a good performance. So this is a bit of a contradiction.”
4.2.2 External factors
The external factors identified to harm the operational performance of Carris were mainly related conflicts with other vehicles and passengers. Traffic, illegal parking, bus lanes usage by right-turns, ride-hailing pick-ups at stops, and micromobility in bus lanes delay services and compromises curb approach, especially along major corridors and tourist areas.
“Ride-hailing was supposed to bring mobility, but it turned out to be the opposite. […] It’s like a game of snakes… They are always at the bus stops. And that adds to the journey time.”
Peaks in touristic demand increase dwell times that schedules don’t absorb, worsening on weekends and holidays when frequencies drop. Drivers advocate for more realistic schedules, as well as for awareness campaigns and active enforcement (with technological assistance) to reduce violations and ensure bus priority.
“For instance, we now have school holiday timetables, but there are certain routes that pass through Cais do Sodré… School holidays or not, it doesn’t matter.”
4.2.3 Strategic planning
At the strategic level, drivers argue the network has not kept up with urban development, calling for more frequent adjustments on routes and stop placements.
“For more than 15 years, the timetables have not been updated in line with the development of the city.”
The lack of toilets at terminal stops was also highlighted as a major issue, forcing drivers to actively look for alternatives that induce operational delays. Intersections and traffic lights were identified as major bottlenecks. Transit signal priority or selective night-time signal shutdowns were pointed out as possible improvements. The urge for more segregation was also emphasized, with dedicated bus lanes and transit-only streets to reduce conflicts with other vehicles. Additionally, stop geometry, sign placement, and lighting were mentioned as needing correction for improved accessibility and safety.
“I see more and more areas of Lisbon that used to have two or three lanes and are being shortened, shortened… To make car parks, or to make cycle lanes. For example, Almirante Reis.”
Drivers value the ongoing fleet renewal, but note reliability issues from older buses, maintenance bottlenecks, and some mismatches in the recent interventions (for instance, new ergonomic seats that reduces driving comfort). Regarding working conditions, their career was described as unattractive due to the low entry salary associated to a slow progression that leads to an undersized working force, used to overtime working hours.
4.2.4 Tactical planning
On tactical planning, drivers characterize schedules as unrealistic, with planned times not accounting for traffic, urban changes or touristic demand, that together with staff shortages lead to inconsistent frequencies and delays, with a snowball effect through the day. Drivers advocate for turnaround times to be increased every couple of trips to enable a realistic delay recovery during operation, as well as for more realistic and frequent schedule adjustments that consider urban changes and seasonal demand variations.
“If there’s no school, traffic conditions are better, indeed. Which makes the schedules to be shortened. But the route is the same. And yes, there are fewer passengers, but if the route has fewer cars, they accumulate… In the end, you’re still late.”
Ticketing was highlighted as a recent positive improvement on Carris operation, with contactless introduction cutting cash-handling delays and improving drivers’ security perception. At heavy stops, drivers suggest all-door boarding and ticket validation to reduce dwell times.
“There were days when I sold an average of 400, 500 euros a day. And all the complications associated with making the change… Sometimes I’d stop for 20 minutes… It was a very slow process. Now it is much better!”
4.2.5 Operational management
Regarding operational management, driver shortage was reported to compromise up to 50% of the planned services, inducing frequent overtime and working schedule irregularity.
“For instance, there was a time in Musgueira when there were no drivers for 40% of the service. […] This is a lot of work that is not being done. Or it is being done, but on overtime.”
Central dispatch is valued for coordinating operations, but drivers report friction points: early “proceed” orders compromise their time to rest in between services and slow radio call-backs blocks drivers from performing actions that could improve operational performance. XTraN operating assistance system, despite described as useful, lacks a revision on message categories, clearer feedback to drivers and more reliable connectivity.
“XTraN records the time it takes us to travel. All they had to do was study that for a period of time and they would see that the timetables are out of sync.”
Passenger information was also identified as in need of improvements. Finally, enforcement was considered necessary to discourage road code infractions.
4.2.6 Drivers’ self-consciousness
Drivers express pride in Carris mission and their role, but also a sense of not being considered in decisions that shape their daily work and service outcomes.
“It seems that everyone is considered, except for those who will perform that service.”
In response, some adopt informal procedures (from tactical boarding maneuvers to coordinated efforts to expose unrealistic schedules) to protect safety and signal systemic issues. They show high self-awareness of performance trade-offs and acknowledge variability in colleagues’ responses to pressure. Overall, they believe that the company would benefit from evolving into a more dynamic, participated and inclusive decision framework.
“I think there are people there who have very good ideas and very good opinions, and sometimes they are not heard… […] Perhaps a better service would be provided if we listened to those who actually… get their hands on…”
4.3 Focus group ranking analysis
The focus group produced rich and diverse insights. From the 18,385 words transcribed, 67.6% were coded, with “Strategic Planning” emerging as the most prevalent category (considering number of words coded), followed by “Operational Management” and “Drivers’ Self-Consciousness”. This shows that drivers think beyond their functional role and hold valuable system-wide perspectives. Participants mentioned outdated network design, inadequate terminal facilities, and inefficient intersections as key barriers to efficiency and well-being, underscoring their strategic awareness of structural issues. At the tactical level, “Route Scheduling” dominated discussion, with drivers describing unrealistic timetables and short recovery periods that propagate delays.
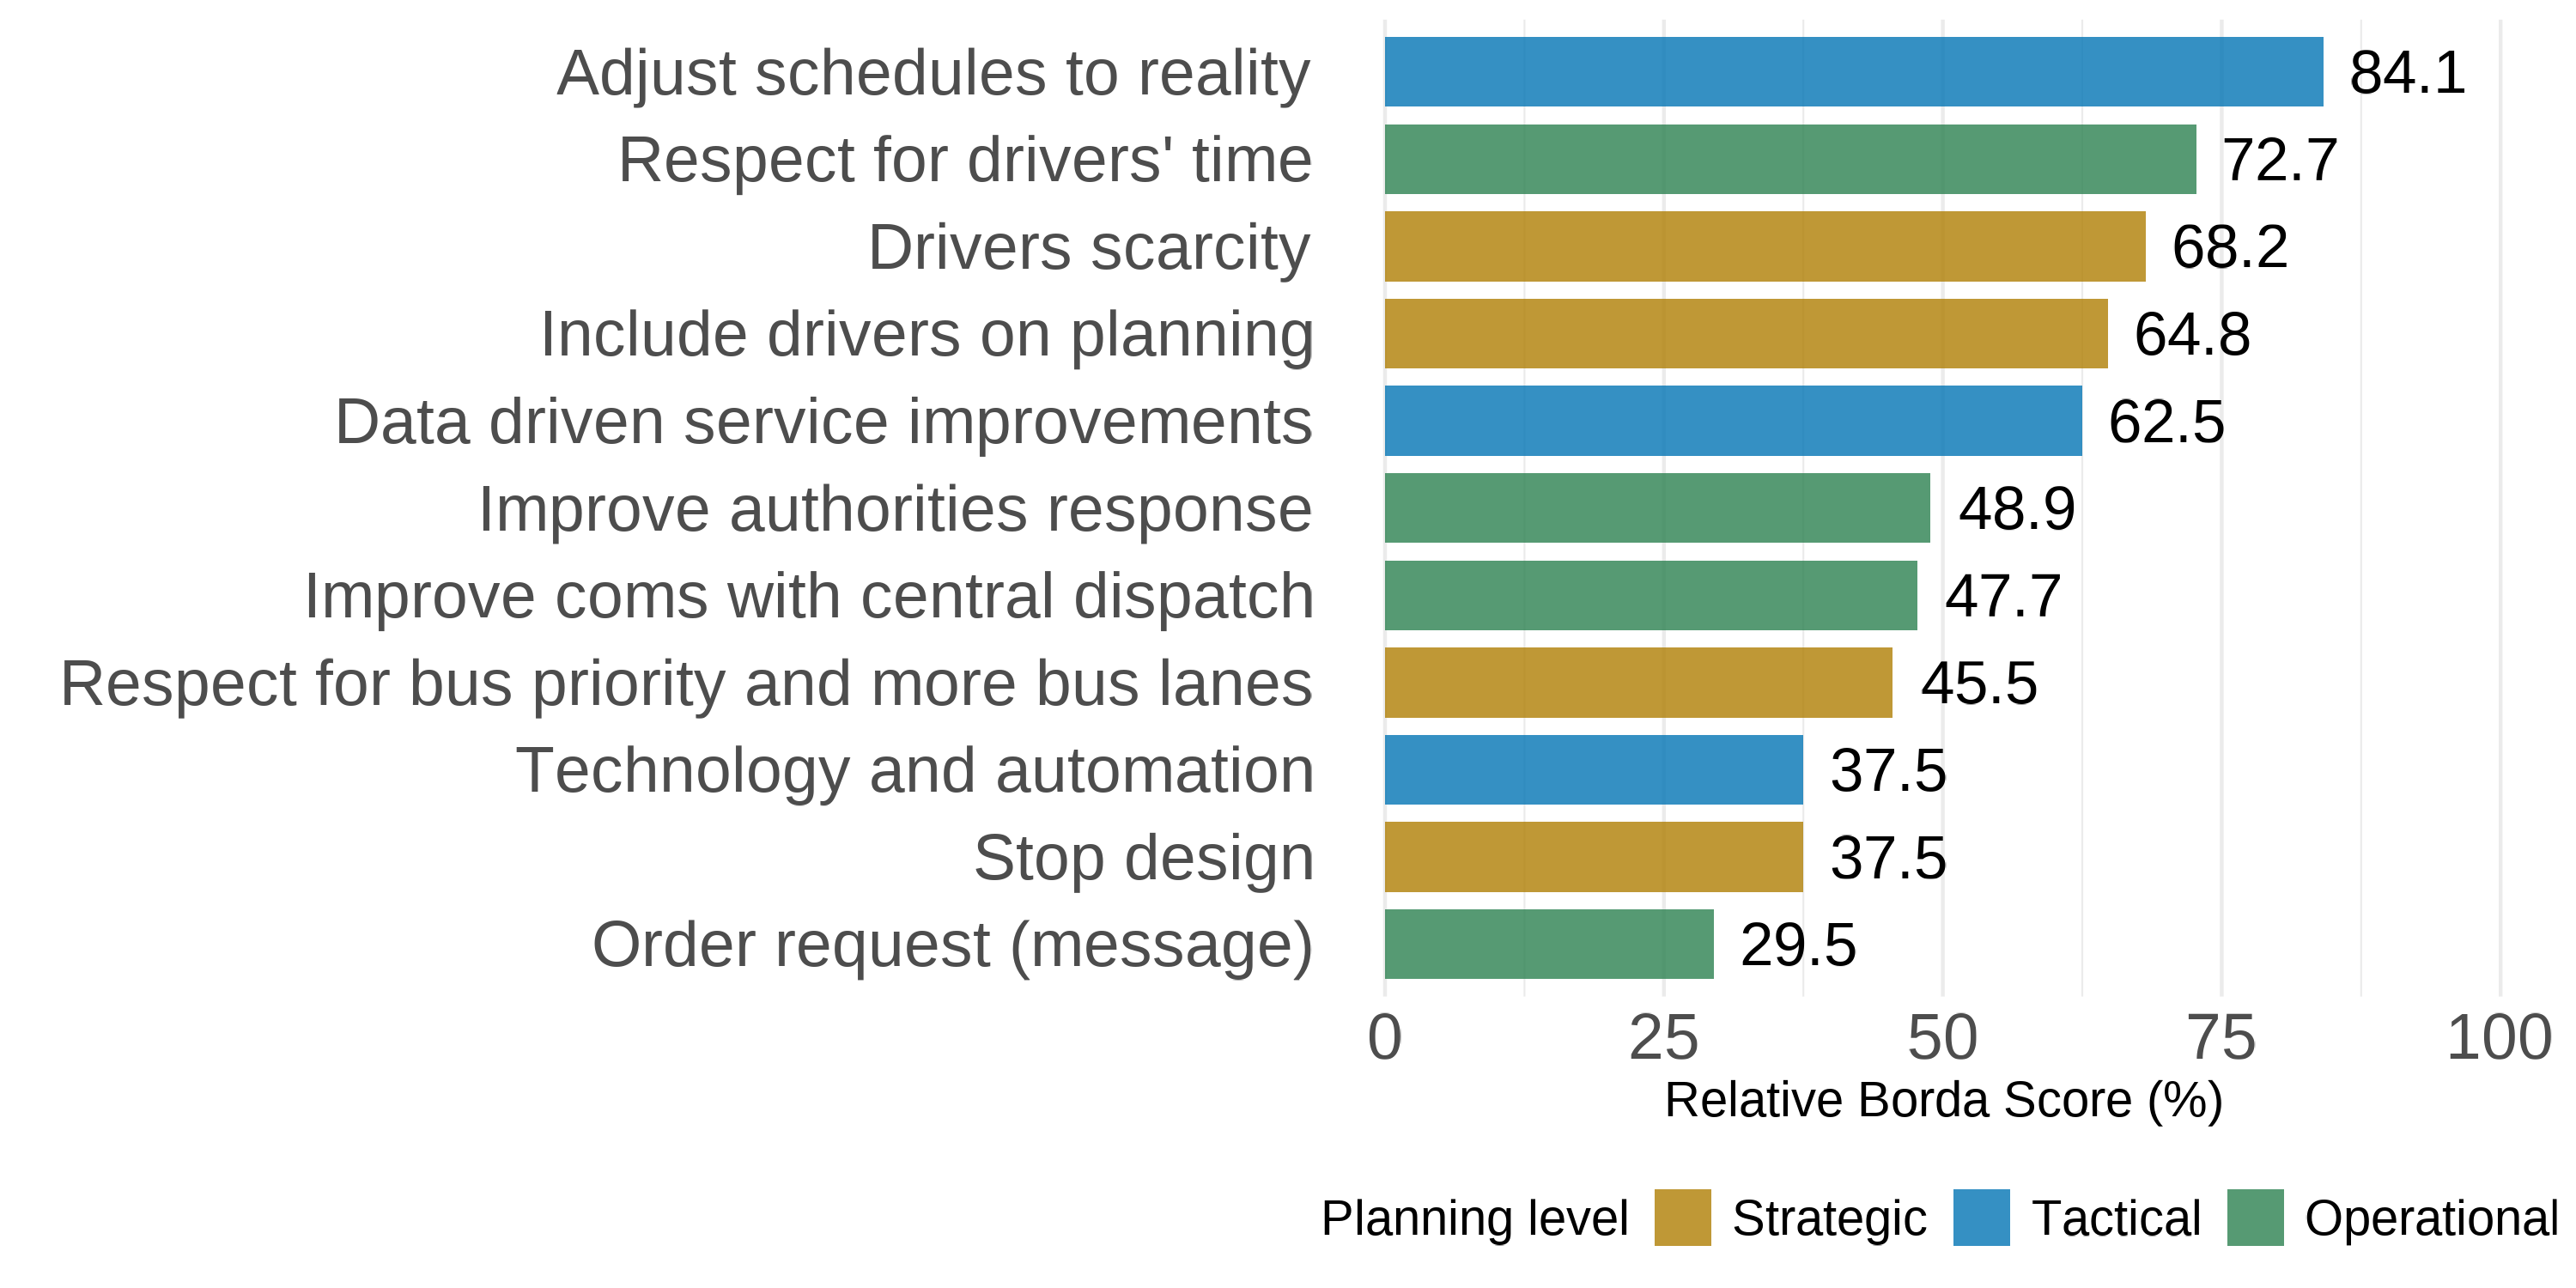
Their ranking of 11 operational factors confirmed these priorities (Figure 4): “Adjust schedules to reality”, “Respect for drivers’ time” and “Driver scarcity” scored highest, with moderate consensus among participants (Kendall’s W = 0.32, p < .01). When aggregated by planning level, tactical factors had the greatest perceived impact, followed by strategic considerations, while operational management ranked lowest, indicating that drivers’ tacit knowledge extends far beyond day-to-day operations and can meaningfully inform higher-level planning and decision-making.
5 Discussion
5.1 Comparing Findings With Previous Studies
The results of this research align closely with existing literature. Drivers demonstrated a broad understanding of the factors that influence operations, echoing the internal and external determinants identified in the literature. All external factors and nearly all internal ones (such as service planning, vehicles, stop design and operation, bus lanes and drivers) were raised during the focus group, revealing a deep understanding of how planning choices translate into daily performance constraints, in accordance with Van Oort (2011) perspective. Table 2 synthesizes these overlaps, mapping the literature findings compiled by Cordera et al. (2024) and Van Oort (2011) (adapted and extended with additional relevant sources) and complementing it with the focus group insights.
Drivers reflections on the outdated network design, impacts of boarding conditions and the limited bus priority illustrate this broad comprehension, revealing that drivers internalize operational logic even without formal analytical tools. Similarly, external influences were also reflected upon, revealing a perception not as random disruptions but as predictable patterns that could also be incorporated in service planning to mitigate their impacts. “Urban environment” was the only missing one, but it was not addressed during the focus group.
Beyond these overlaps, new internal dimensions emerged, such as “Service Operation”, highlighting the relevance of the operating assistance systems for operational efficiency and enforcement to discourage traffic violations. “Governance” also came up, covering working conditions and the company commitment to stakeholder engagement, aligning with Cambra (2012) perspective about the importance of institutional commitment for the overall system improvement.
Overall, integrating drivers’ perspectives with the literature demonstrates a complementary and systemic view of the bus network, revealing drivers to have relevant and unexpected outcomes that in some circumstances can be critical. Their testimonies show awareness of how strategic and tactical decisions affect service reliability. Actually, it is noticeable that when asked to prioritize the factors that have an higher impact on Carris operational performance, tactical and strategic factors were globally ranked higher than operational ones.
Yet, as drivers themselves emphasized, there remains a lack of formal mechanisms for their participation in decision-making. This absence reflects an organizational blind spot that overlooks a valuable source of tacit expertise capable of identifying systemic vulnerabilities, from unrealistic timetables and missing facilities to inefficient communication through control systems. In line with Nakanishi and Kittelson & Associates, Inc (2003) and Cambra (2012), these findings highlight the benefits of institutional commitment with employee inclusion and underscore the need for feedback structures that convert experiential knowledge into actionable insights for continuous system improvement.
| Factor | Subfactor | Literature summary | Literature references | Focus group category | Drivers’ insights |
|---|---|---|---|---|---|
| Service planning | Network design | Trip distance, stop spacing and number of signalized intersections affect route performance. | Abkowitz and Engelstein (1983); Akandwanaho, Iryo, and Nakamura (2018); Levinson (1983) | Strategic planning | Drivers identify a network that is not adjusted to the city urban development. |
| Schedule quality | A schedule that can’t accommodate stochastic operational events induces service variability. | Desfontaines and Desaulniers (2018); Guihaire and Hao (2010); Van Oort (2011) | Tactical planning | Drivers report schedules that do not accommodate enough for stochastic operational events, inducing service variability. | |
| Vehicle | Modernization | Modern vehicles contribute to a more comfortable and reliable service, increasing ridership. | Hoard (1940) | Strategic planning | Drivers recognize the efforts to modernize the fleet, but point out some misfits in this process and highlight impacts of old ones still operating. |
| Stop design | Location | Stops located after an intersection have less conflicts with other vehicles (right-turns) and pedestrians (crossings behind the bus), leading to reduced dwell times. | Wang et al. (2016); Hu and Shalaby (2017); Institute (1996) | Strategic planning | Drivers identify stops that harm operational efficiency. |
| Traffic flow segregation | Bus bays induce delays when the bus re-enters high volume traffic flows. Curbs improve bus performance, but increase through traffic delays. | Fernandez and Tyler (2005); Institute (1996) | Strategic planning | Drivers claim that private vehicles do not respect bus priority when re-entering traffic flow after servicing a stop with bus bay. | |
| Number of berths | Sub-dimensioning might lead to bus queues and increased delays. Nevertheless, more than 3 berths have insignificant improvements. | Wang et al. (2019); Fernandez and Tyler (2005) | Strategic planning | Drivers recognize berths to have positive impacts on stops serviced by several routes. | |
| Stop operation | Boarding conditions | Platform crowding, number of entrance doors and hall dimension influence boarding times. | Fernandez and Tyler (2005); Fletcher and Ahmed (2013); Levinson (1983); NACTO (2017) | Tactical planning | Drivers claim platform crowding to harm operational efficiency and propose considering boarding through all doors. |
| Schedule design | Regularity evens passengers distribution, reduces waiting times and improves on-board conditions. Delays increase with arrival rate and service times. | Cats (2014); Huo et al. (2018); Strathman and Hopper (1993) | Tactical planning | Drivers associate a regular schedule to more even passenger distribution, improved waiting times and on-board conditions. | |
| Traffic lights | High traffic light red ratio increases delays. Traffic lights induced traffic gaps can help re-entrance of buses on traffic flow. Pre-signal with bus advance area and signal priority reduce delays. | Diab and El-Geneidy (2012); Huo et al. (2018); Institute (1996); Wu and Hounsell (1998) | Strategic planning | Drivers point out traffic lights as an operational bottleneck, claiming for transit priority. | |
| Payment system | Number of queues/accesses for on/off-board payment/validation and number of modes supported influence boarding times. | Diab and El-Geneidy (2012); Fernandez and Tyler (2005); Fletcher and Ahmed (2013); NACTO (2017) | Tactical planning | Drivers recognize impact of payment system expeditiousness on boarding times and identify improvements after contactless payment introduction. | |
| Bus lane | Impacts | Bus lanes reduce journey times and promote modal-shift to transit. | Arasan and Vedagiri (2010); Diab and El-Geneidy (2012); Mane et al. (2018) | Strategic planning | Drivers recognize improvements on operational efficiency when bus lanes are provided. |
| Design | Continuous combined bus lanes have a linear return to scale. Sparse and discontinuous networks have little benefits. | Truong, Sarvi, and Currie (2015) | Strategic planning | Drivers claim for a more continuous bus lane network. | |
| Drivers | Experience | More experienced drivers are more subject to fulfill the schedule on time. | Strathman and Hopper (1993) | Drivers self-conscioussness | Drivers value the know-how gained with experience, describing several informal techniques developed to improve operational efficiency· |
| Stress | Delays, passenger load, route familiarity and managerial support are factors that influence driver stress. Drivers with anxiety traits tend to experience more accidents. | Biggs, Dingsdag, and Stenson (2009); Mallia et al. (2015); Tzouras et al. (2020) | Drivers self-conscioussness | Drivers point out stress to hinder their performance and the operational safety. | |
| Fatigue and drowsiness | Fatigue increases with long working hours,reduced intervals between shifts and non-stop working days, leading to more errors and accidents. | Biggs, Dingsdag, and Stenson (2009); Miller et al. (2020); Zaranka, Pečeliūnas, and Matijošius (2012) | Drivers self-conscioussness | Drivers criticize the company incitement for working extra shifts, outlining its impact on fatigue and the consequences it might have for operational safety. | |
| Urban environment | Intersections and corridor design | Geometry of intersections and corridor layout influence crashes occurrence | Duduta et al. (2012); Duduta et al. (2015) | - | - |
| Urban form | Denser environments with traditional, pedestrian-oriented designs, have on average fewer accidents | Dumbaugh and Rae (2009) | - | - | |
| External factors | Weather | Adverse weather conditions have an impact on ridership and travel time. | Changnon (1996); Hofmann and O’Mahony (2005); Tao et al. (2018) | External factors | Rainy days are pointed out to contribute to a traffic chaos in the city and harm bus operations. |
| External factors | Other traffic | Congestion and illegal parking hampers transit travel time and induces unreliability. | Bashingi, Mostafa, and Kumar Das (2020); Furth and Halawani (2018); Kladeftiras and Antoniou (2013) | External factors | Drivers point out traffic as a major inducer of delays and operational disruptions. |
| External factors | Irregular loads | Irregular passenger loads can overburden the transit system. | Li et al. (2017) | External factors | Impact of unregular loads, specially the turistic demand, are pointed out to harm operational efficiency. |
| External factors | Traveler behaviour | The lack of response to changes in travel behavior might degrade transit system perceived performance. | Morency, Trepanier, and Agard (2006); Zhao, Cui, and Levinson (2023); Zhong et al. (2015) | External factors | The mismatch between the city dynamics (and consequently the travel demand) and the current network is pointed out by the drivers. |
| Service operation | Operating assistance system | - | - | Operational management | Drivers recognize the importance of operating assistance systems on operational coordination, enhancing productivity and simplifying communication. |
| Service operation | Enforcement | - | - | Operational management | Drivers consider that presence of highway patrols dissuade infractions that hamper bus operations, such as illegal parking or bus lane trespassing. |
| Governance | Working conditions | - | - | Strategic planning | Drivers report an unatractive career, that induces staff shortages and reduces service reliability. |
| Governance | Company commitment on stakeholder engagement | - | - | Drivers self-conscioussness | Drivers identify relevant and unexpected outcomes about several monitoring and planning dimensions, but feeling the company is not open to ear them discourages their involvement. |
5.2 Drivers’ Knowledge for Bus Monitoring
Drivers’ knowledge represents an important interface between tacit experience and explicit operational data in bus service monitoring. On benchmarking interviews, most operators reported using technological systems that combine real-time tracking with driver feedback channels, transforming situational awareness and judgment into actionable information for controllers. Carris is aligned with these practices through XTraN system, which connects drivers to the Operational Control Center. However, focus group findings reveal a system misaligned with operational needs: predefined message categories are outdated, incomplete, or inconveniently ordered and critical options (such as requesting schedule adjustments) are missing. These design flaws reduce communication efficiency and limit the system’s ability to convert tacit field knowledge into explicit, structured data.
Involving drivers on the design processes of these tools could tackle these issues, ensuring that they reflect real-world operational contexts and priorities. Furthermore, drivers reported a lack of feedback on their messages, which undermines their engagement and the system’s learning potential. Implementing structured feedback loops that inform drivers about how their inputs influence decisions would enhance their sense of contribution and improve data quality.
5.3 Drivers’ Knowledge for Bus Planning
In contrast with operational monitoring, drivers’ participation in bus planning is still incipient. Controllers interviews confirmed that no operators require driver involvement in network design, though some allow informal or voluntary feedback. Portland revealed the most structured example, in which suggestions are submitted through a dedicated form reviewed by planners. Carris lacks formal mechanisms for such participation. Focus group discussions revealed that drivers perceive their input as undervalued, despite possessing detailed tacit knowledge about how planned services perform in practice. Unfeasible schedule changes, unsuitable seat replacements and overlooked terminal constraints were some examples in which including drivers could have prevented inefficiencies.
Drivers field interpersonal (contact with passengers) and experience-based knowledge revealed they have valuable insights with potential to complement planners’ explicit, data-based knowledge, offering a crucial perspective to bridge the gap between design intent and real-world performance.
6 Conclusions
6.1 Main Findings
This research demonstrated how bus drivers’ tacit knowledge can enhance both the monitoring and planning of public transport systems. Drivers qualitative insights showed that their field experience has the potential to extend explicit knowledge, providing contextual understanding that can ultimately improve reliability, planning accuracy and responsiveness. Drivers possess a comprehensive awareness of all planning levels, identifying network bottlenecks, behavioral patterns, and infrastructure gaps that are often invisible to data-driven tools. The findings also highlight a structural lack of formal participation channels for drivers, despite their unique proximity to both operations and passengers. Incorporating their experience into structured feedback and feedforward processes would make planning more adaptive, inclusive, and informed, establishing a continuous learning cycle where explicit systems document performance and tacit insights interpret meaning, turning experience into organizational knowledge.
6.2 Methodological Contributions
Beyond the empirical findings, this paper introduces a methodological framework that can be applied to evaluate and enhance existing bus operations monitoring and planing in other cities. This framework provides a replicable process for transit operators to identify latent operational inefficiencies, evaluate communication and operating assistance systems, and design participatory mechanisms that transform drivers into active contributors to organizational learning.
6.3 Limitations and Future Work
Despite the foundation of its methods and alignment with existing literature, this study’s conclusions should be interpreted in light of its limitations, including the small interview sample and the single focus group. Future research could broaden participation to validate findings, explore the long-term effects of driver inclusion on service performance and study how the operational assistance systems can contribute to capture the drivers knowledge.
References
Footnotes
Search for topic field (title, abstract, author keywords and keywords plus) with the following query: (“bus transit” or “bus network”) and (“monitoring” OR “tracking” OR “assessment” OR “planning” OR “design” OR “development” OR “strategy”)↩︎