Through the Bus Driver’s Eye
Linking Operational Data and Driver Perspectives
to Bus Services Monitoring and Planning
Author Gonçalo André Ferreira Matos
Thesis to obtain the Master of Science Degree in Transportation Systems
Supervisors Dr. Rosa Félix and Prof. Filipe Moura
Juri Prof. José Neves and Prof. Tiago Farias

1. Motivation


It is crucial to study solutions to improve its efficiency and reliability
1. Motivation + 2. Literature Review
How are these problems being addressed?
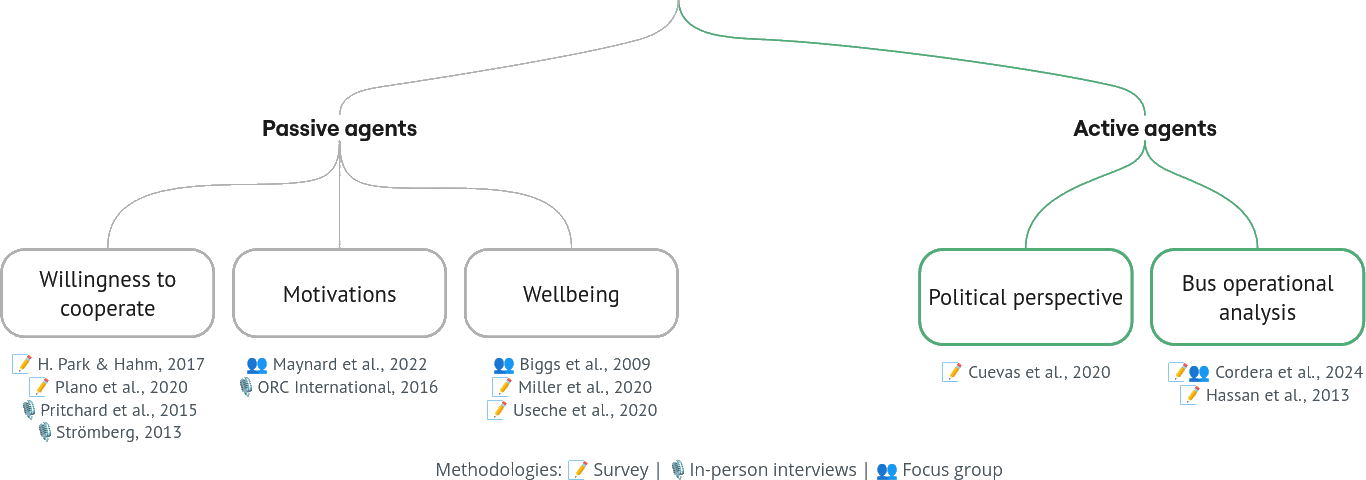
Literature focuses on passenger satisfaction and performance-driven indicators
Drivers are overlooked by most studies
1. Motivation + 2. Literature Review
How are these problems being addressed?
Literature focuses on passenger satisfaction and performance-driven indicators
Drivers are overlooked by most studies
Considered as an output of the system
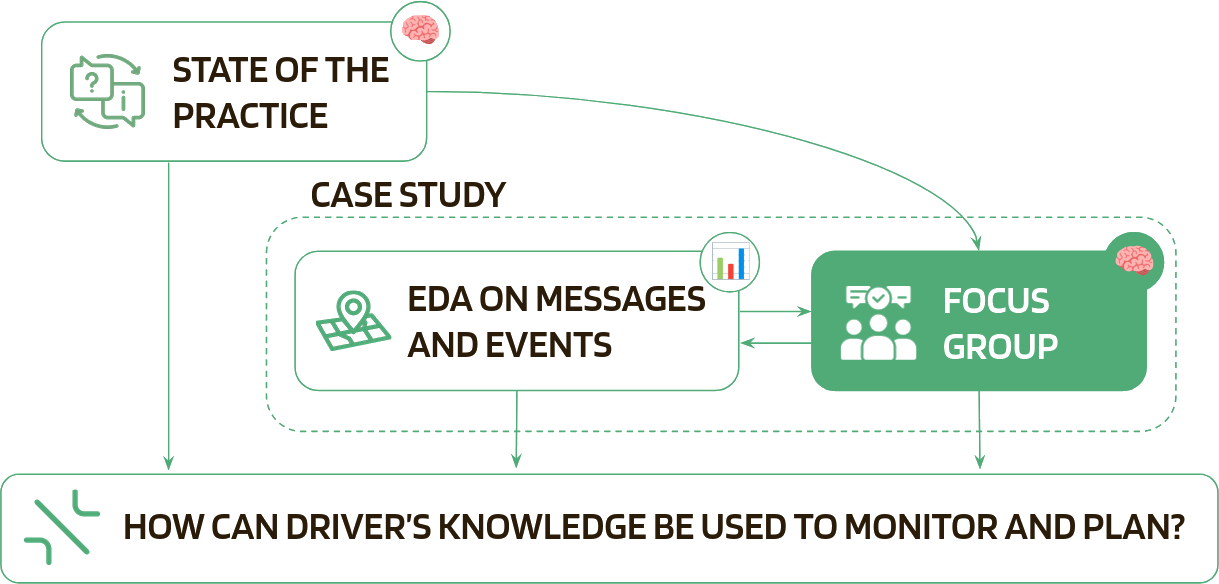
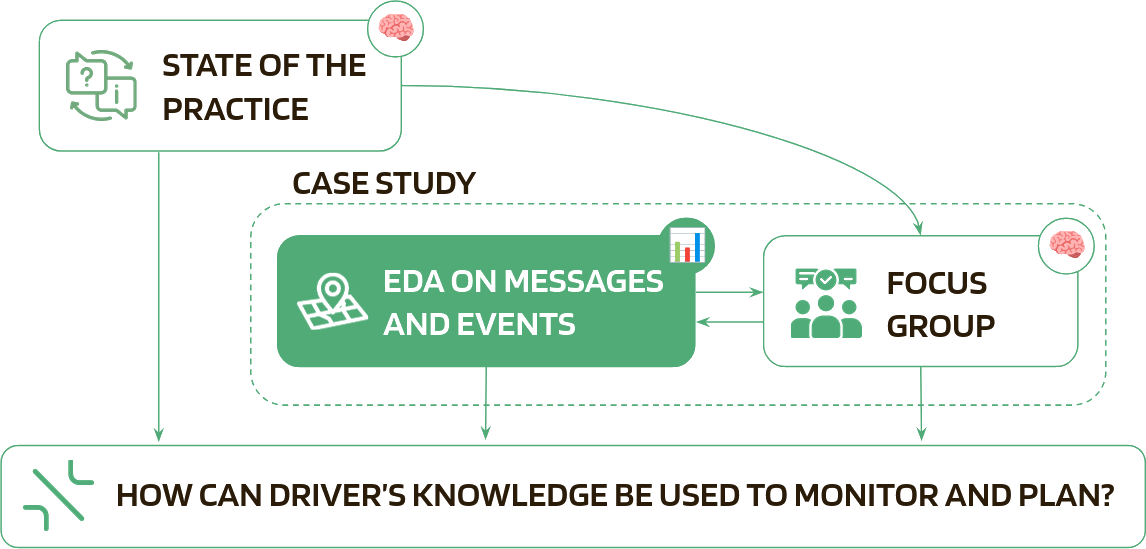
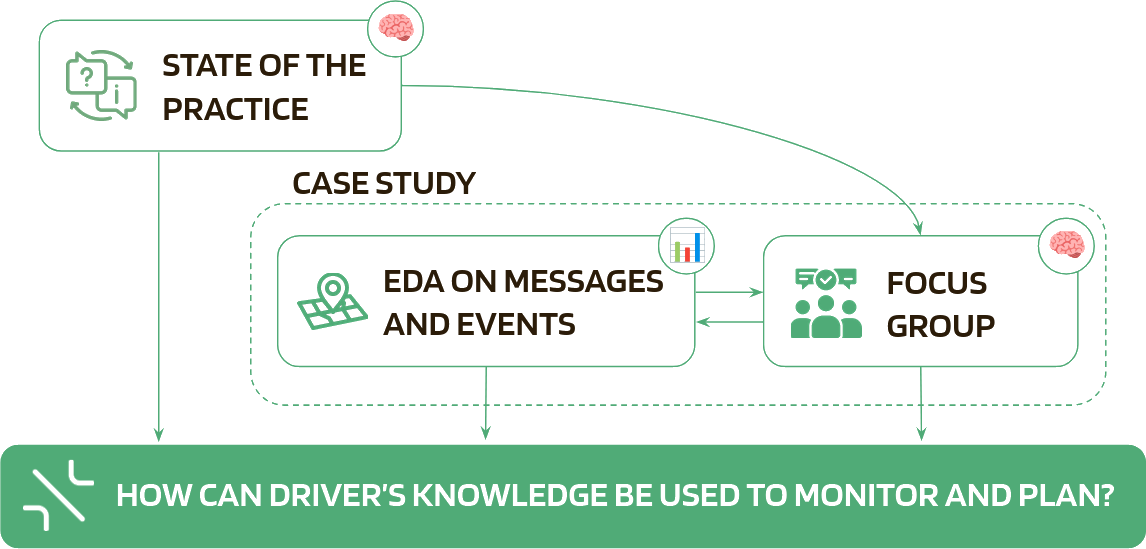
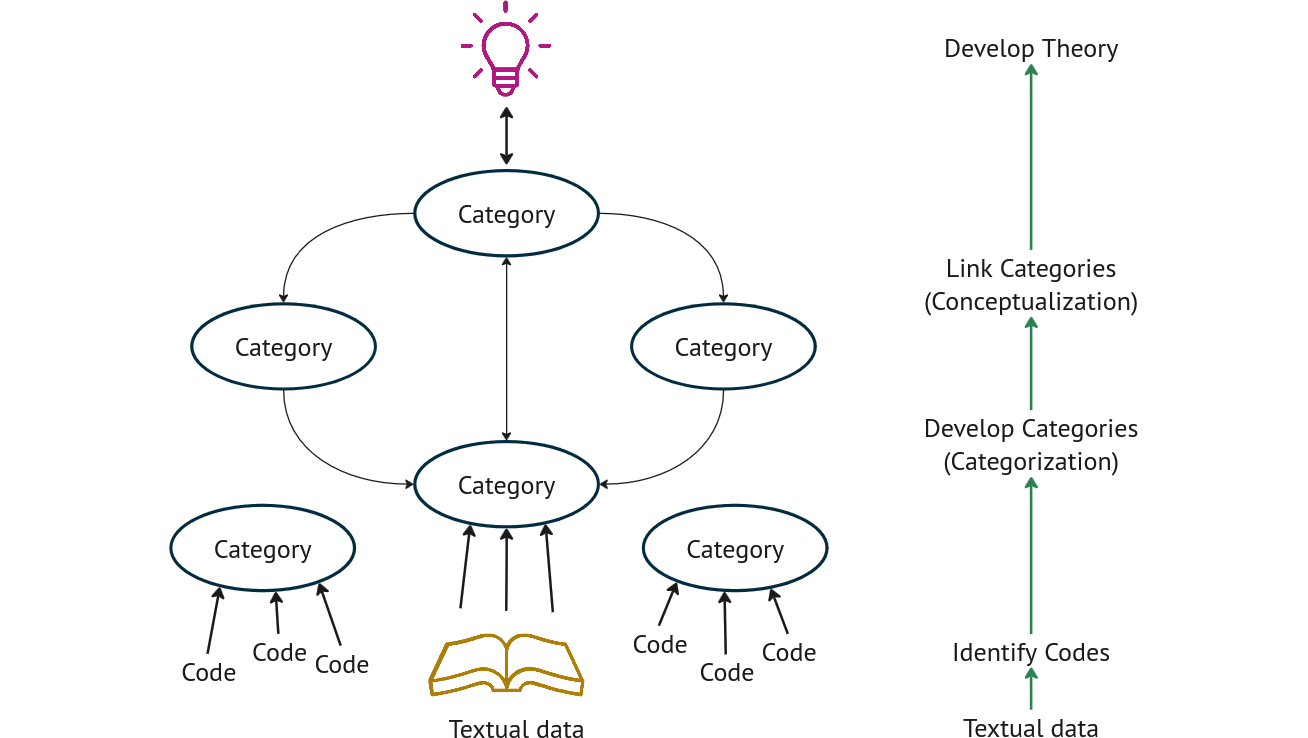
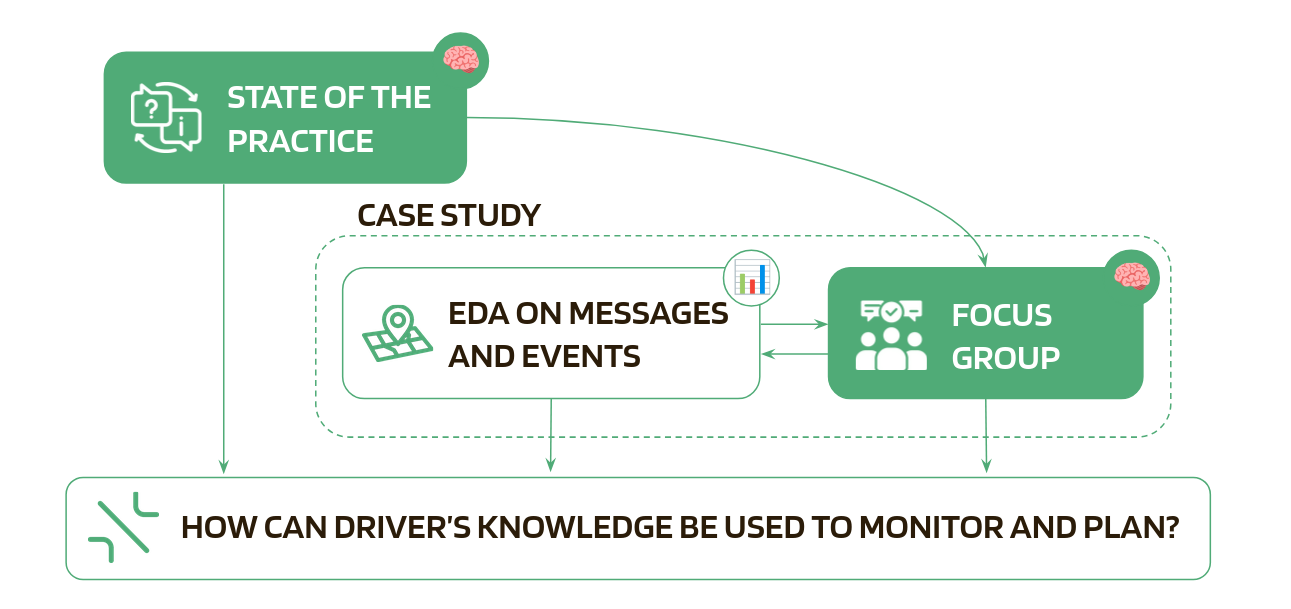
3. Methodology
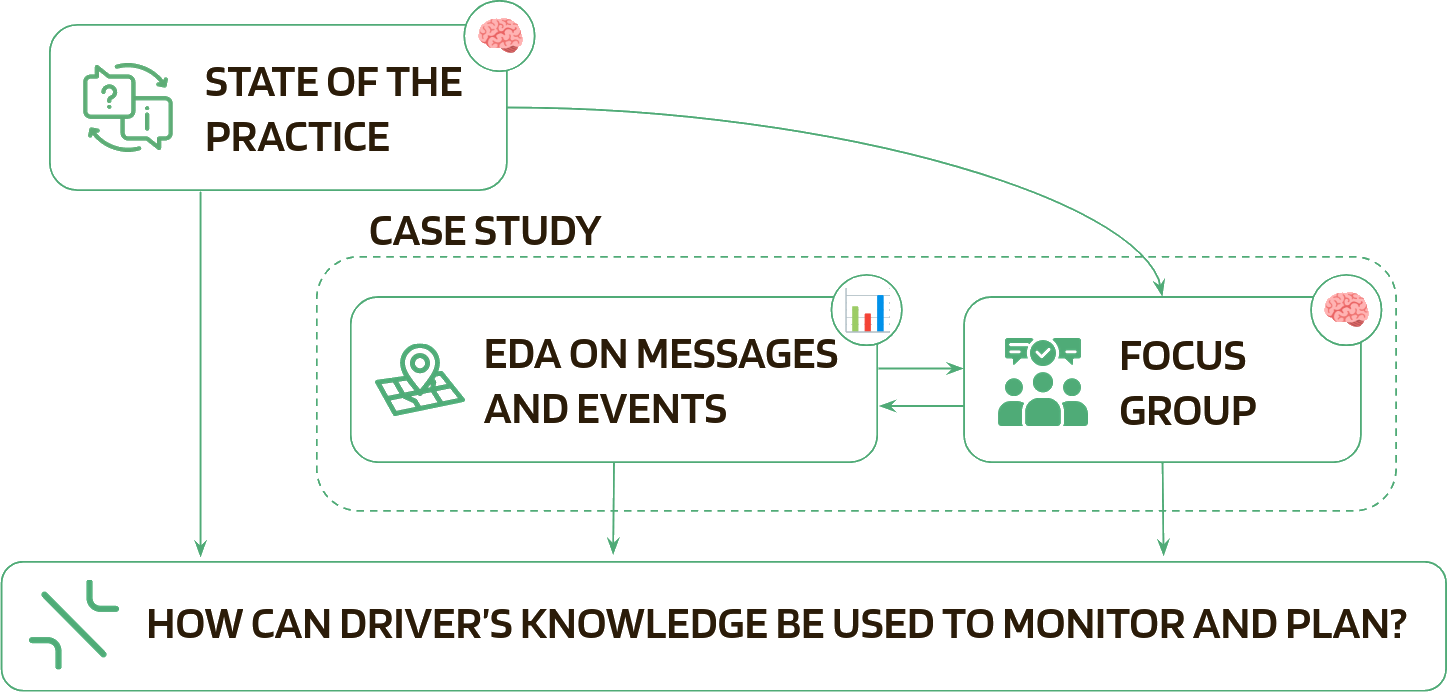
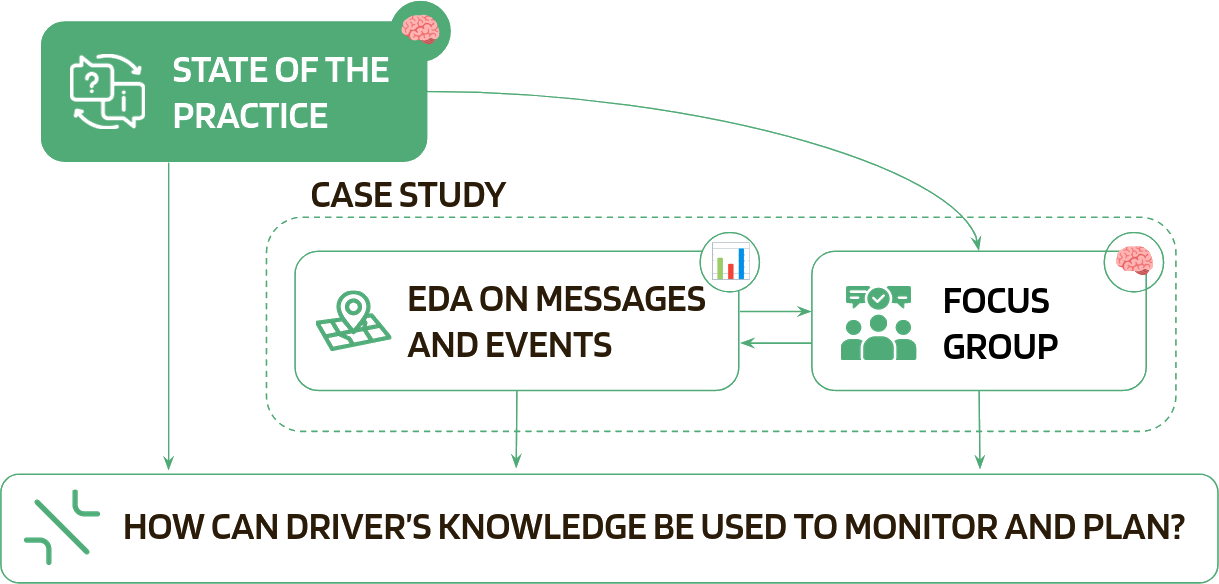
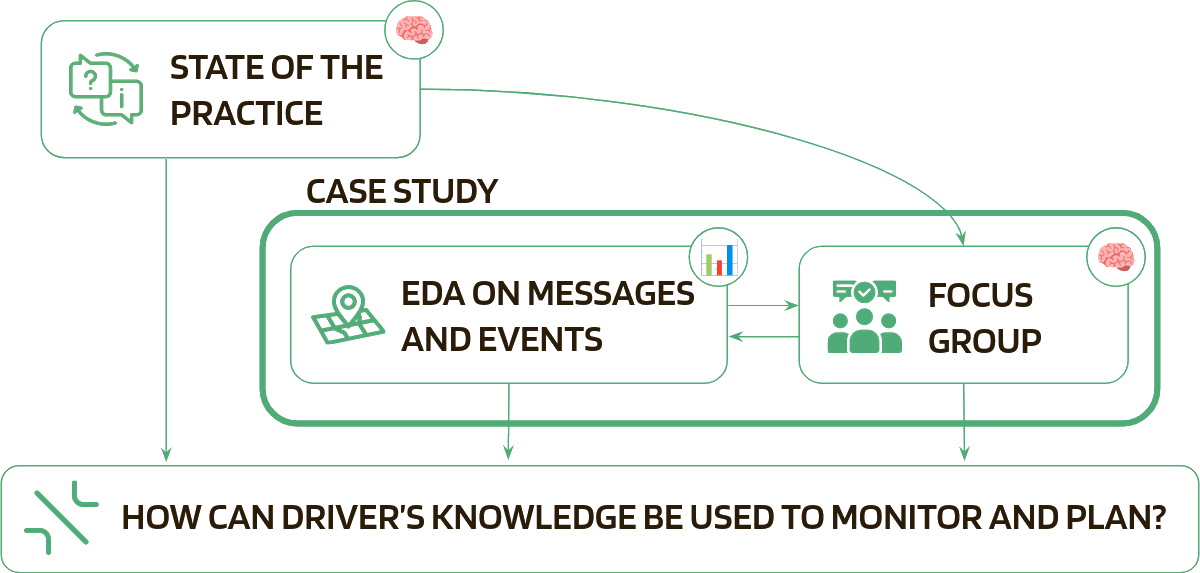
Mixed-methods approach to capture both the 📊 explicit and 🧠 tacit knowledge
3. Methodology
Mixed-methods approach to capture both the 📊 explicit and 🧠 tacit knowledge
3. Methodology
Mixed-methods approach to capture both the 📊 explicit and 🧠 tacit knowledge
3. Methodology
Mixed-methods approach to capture both the 📊 explicit and 🧠 tacit knowledge
3. Methodology
Mixed-methods approach to capture both the 📊 explicit and 🧠 tacit knowledge
3. Methodology
Mixed-methods approach to capture both the 📊 explicit and 🧠 tacit knowledge
3. Methodology
![]() State-of-the-Practice
State-of-the-Practice
Structured interviews with operational control professionals from several cities
3. Methodology
![]() Case Study
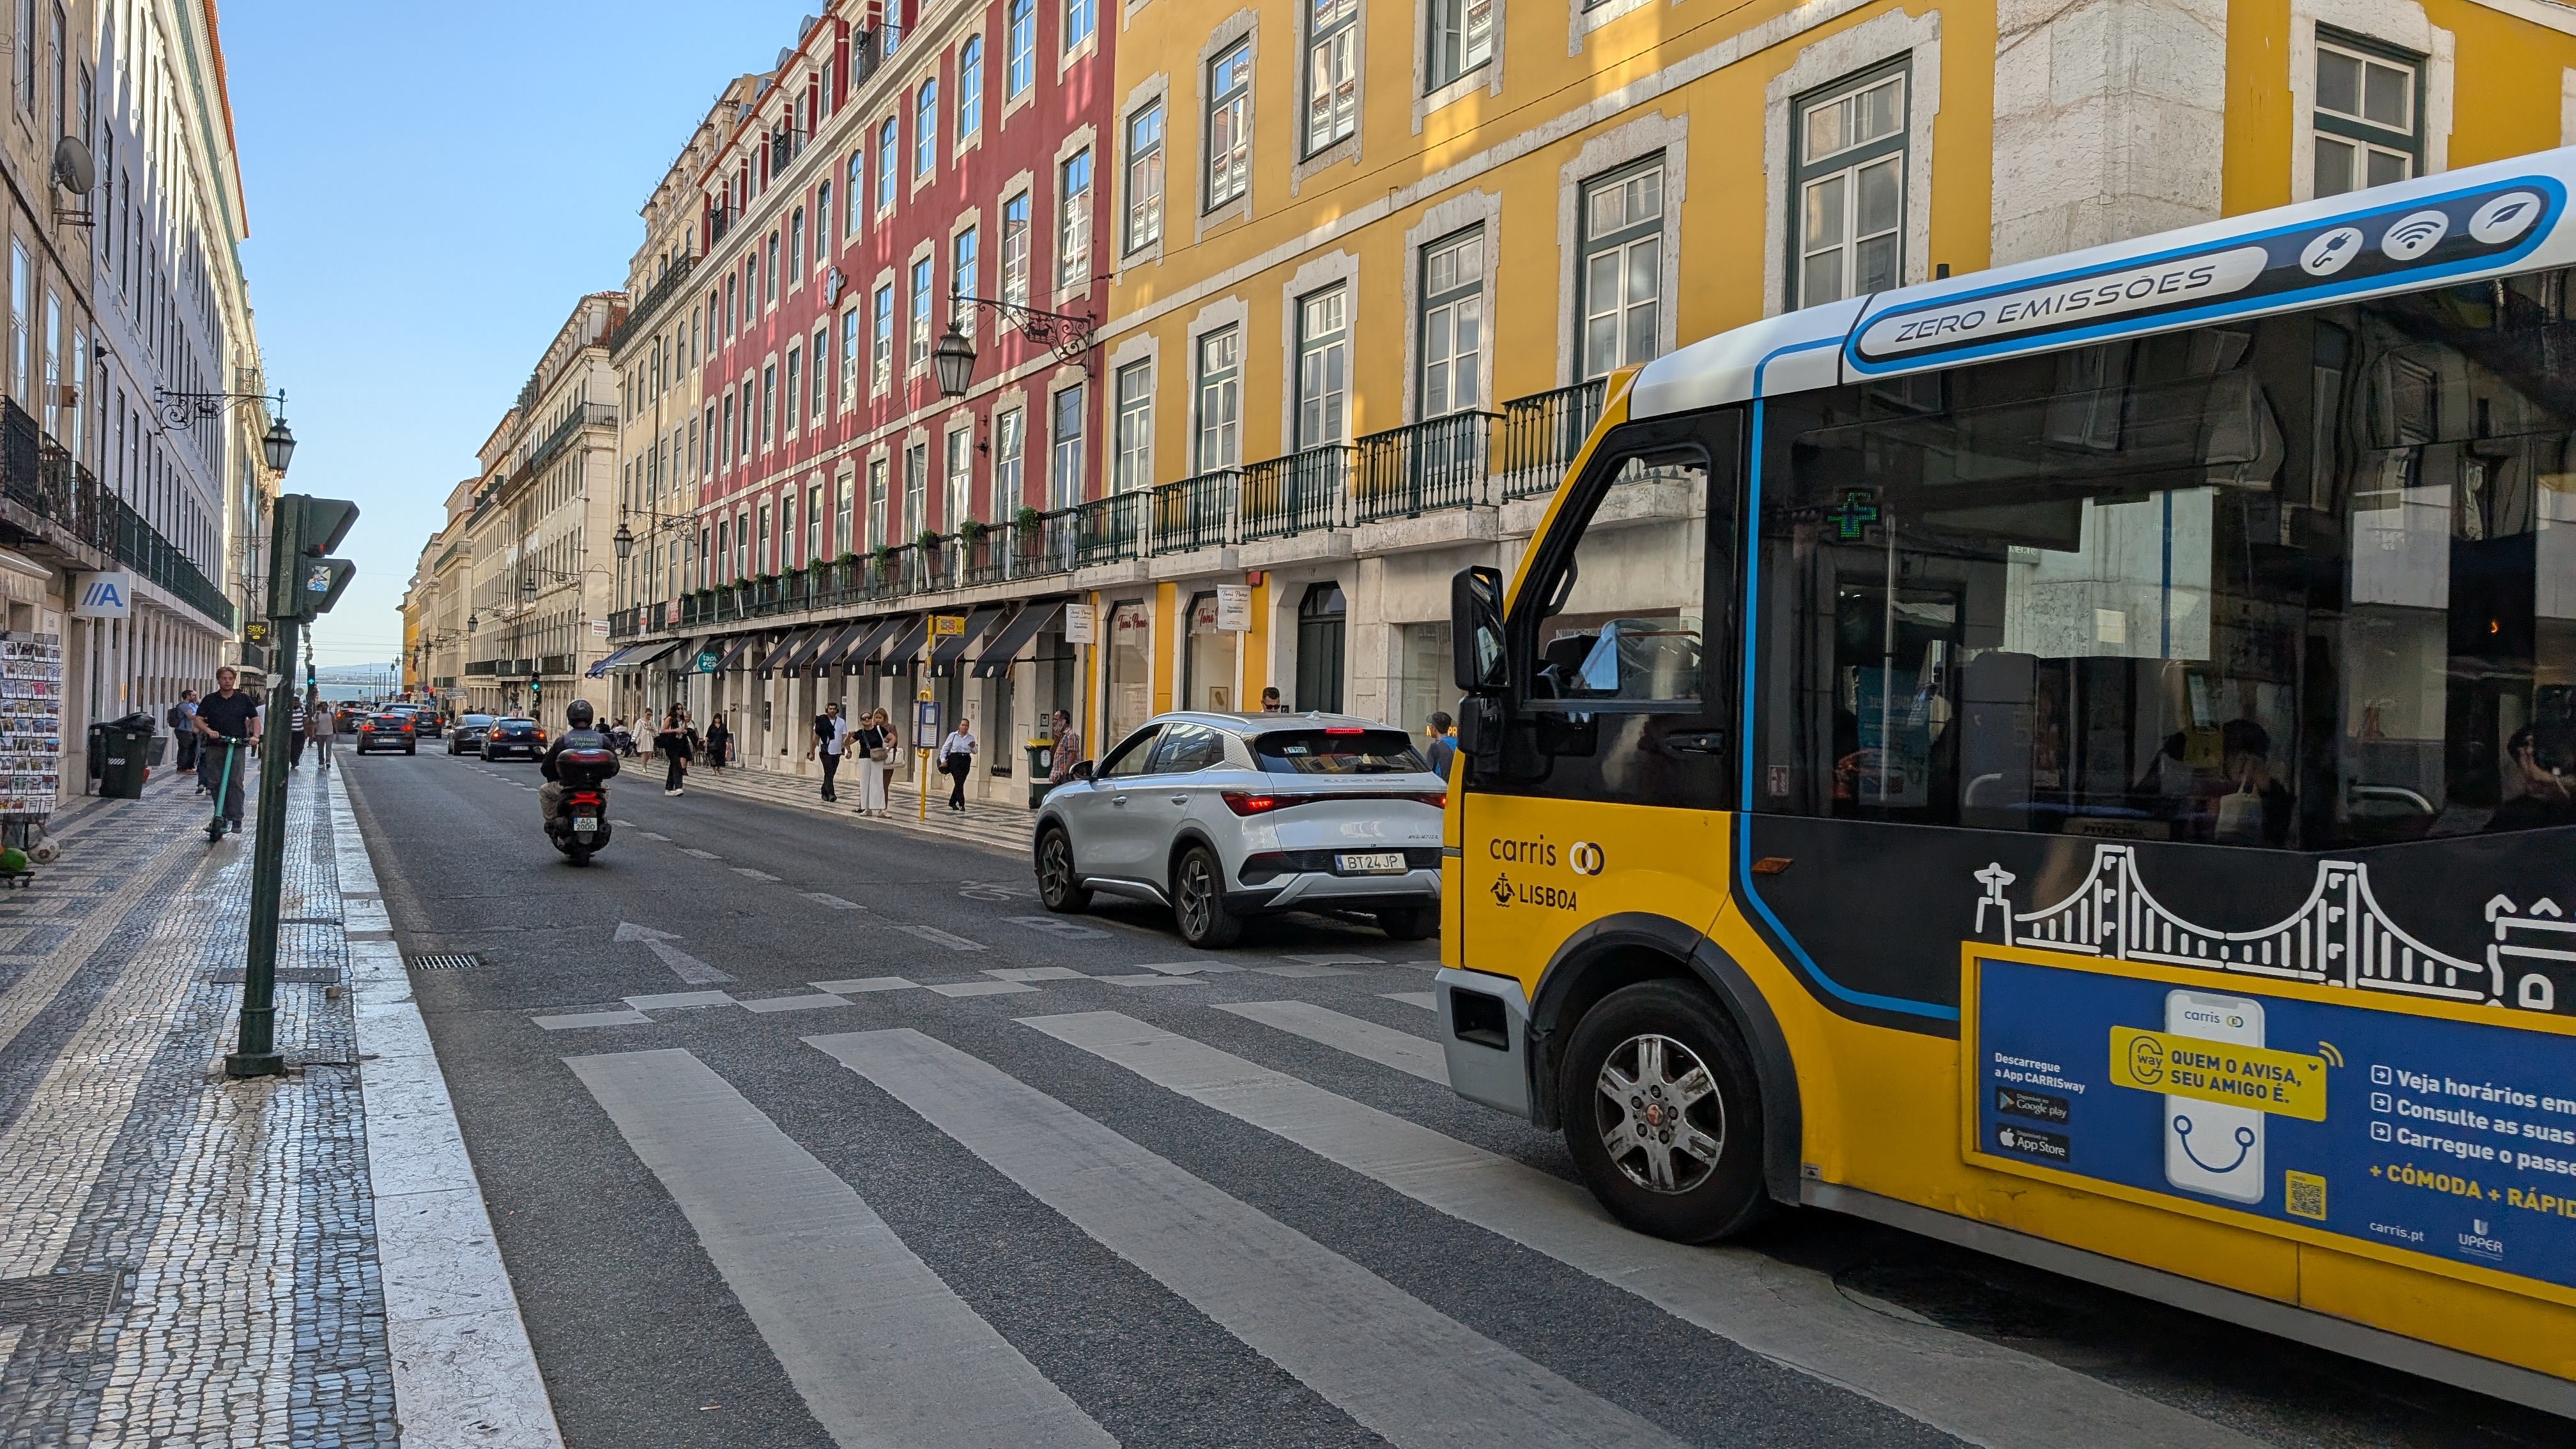
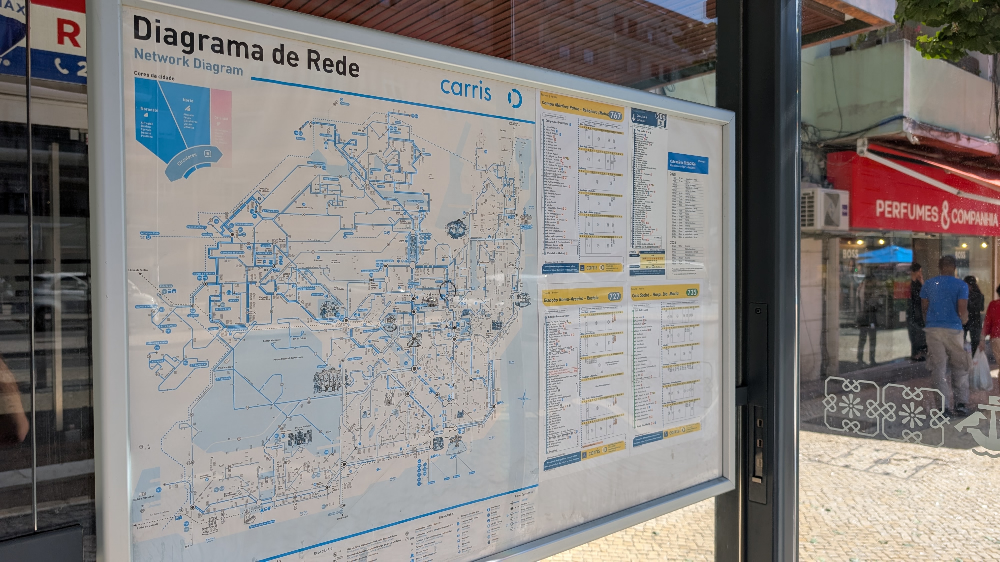
Case Study
Lisbon public bus operator, part of Navegante multimodal system
102
Routes
1,658
Drivers
100 M
Pax/Year
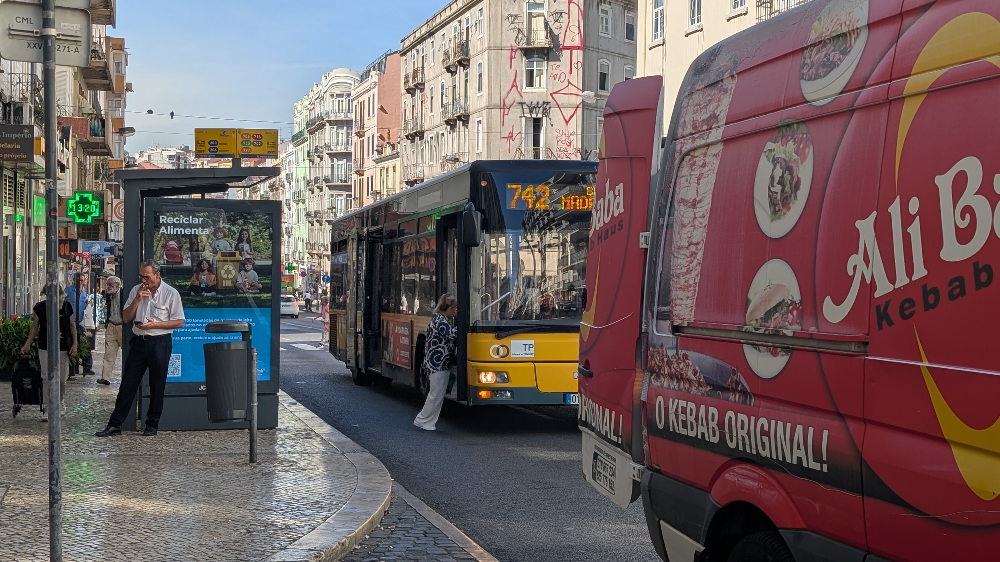
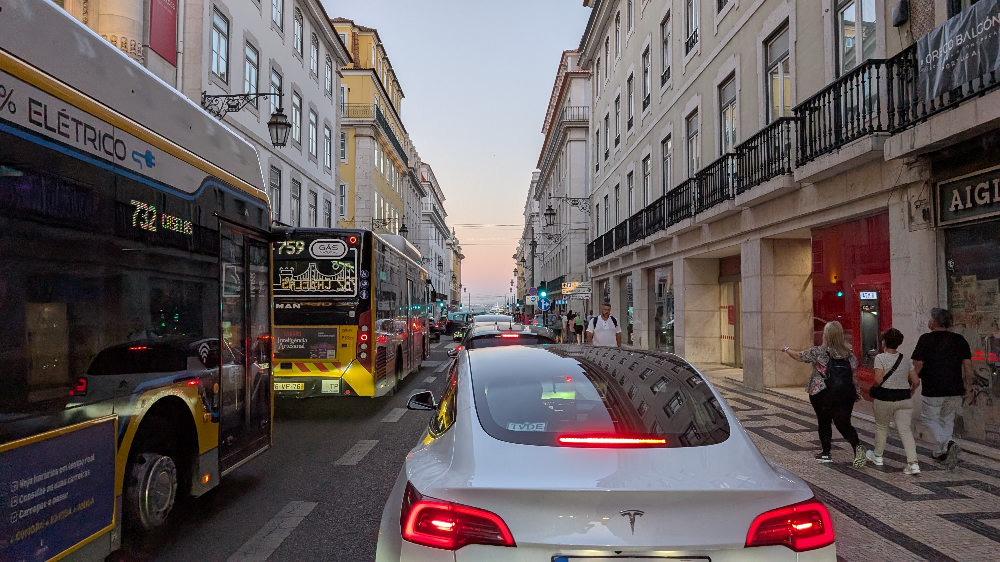
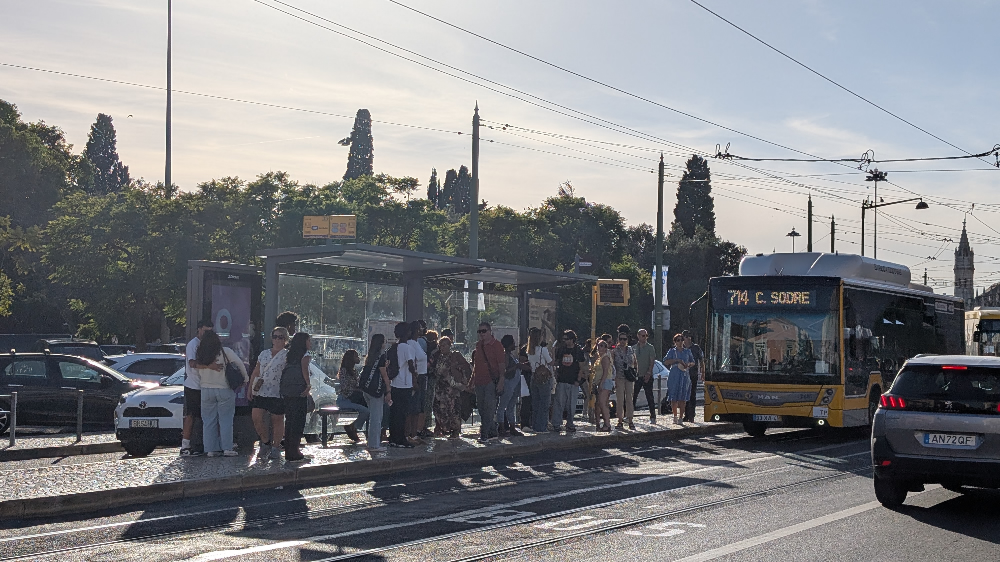
3. Methodology
![]() Case Study
Case Study
Carris faces growing challenges caused by 🚗 conflicts with private vehicles and
🚧 construction works (Carris 2024)
Demonstrated by Carris and computed indicators
Yellow indicators were computed by the author, considering operational events for May 2025
13.71
Km/h
7.5 %
Bus bunching
4.9 %
Short turns
95 %
Regularity
3. Methodology
![]() Focus Group Method and Analysis
Focus Group Method and Analysis


1 session with 8 drivers, sampled by operator with diversity criteria
3. Methodology
![]() Focus Group Method and Analysis
Focus Group Method and Analysis
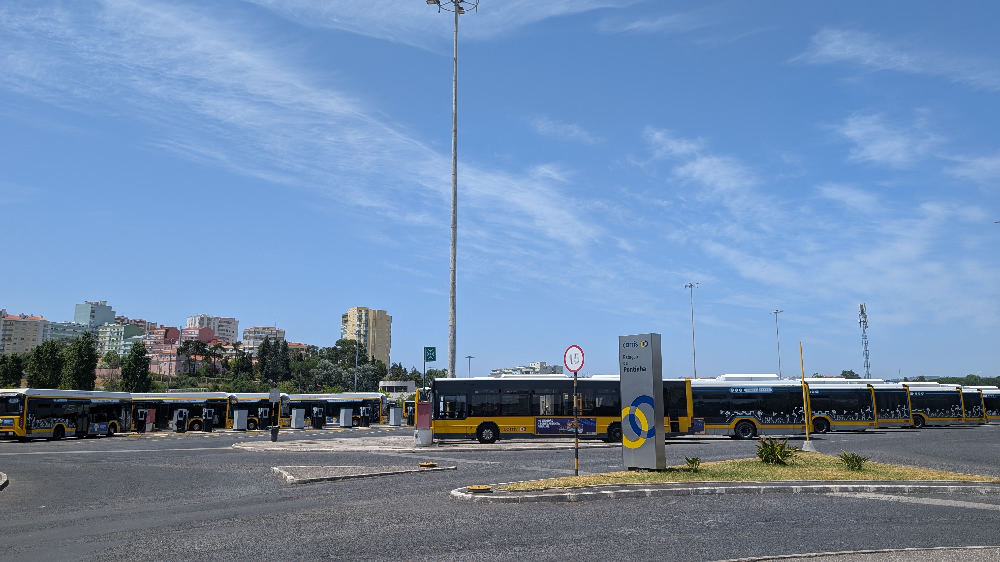
Held at Pontinha Garage, lasting 90 minutes
3. Methodology
![]() Focus Group Method and Analysis
Focus Group Method and Analysis
Moderated by research team, following a semi-structured discussion
(Hennink, Hutter, and Bailey 2020; Tracy 2013)
3. Methodology
![]() Focus Group Method and Analysis
Focus Group Method and Analysis
3. Methodology
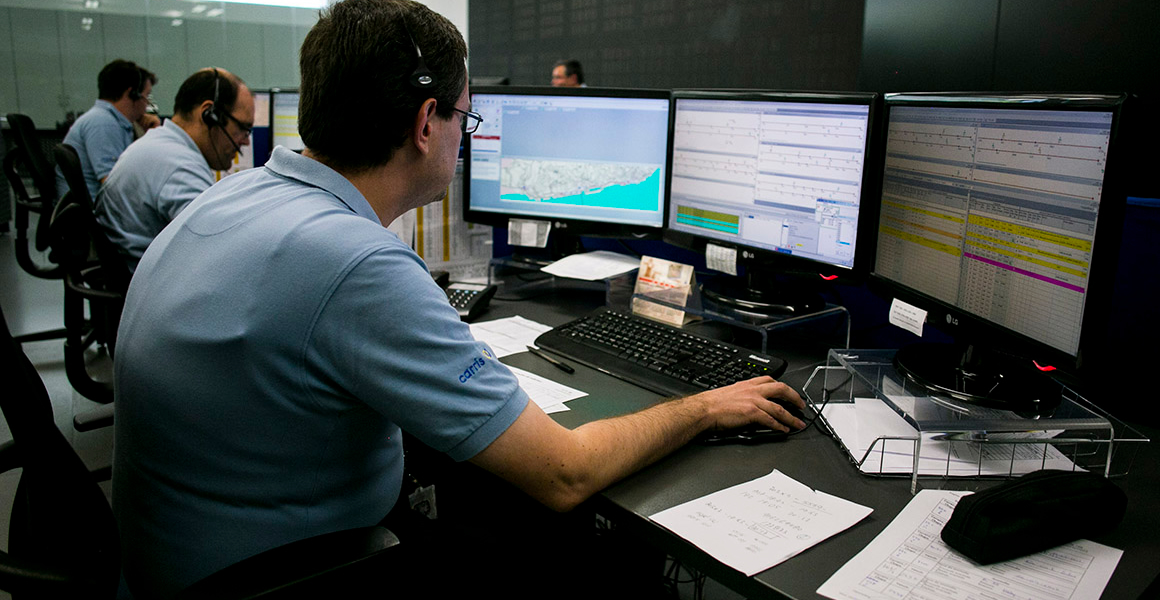
![]() Exploratory Data Analysis
Exploratory Data Analysis
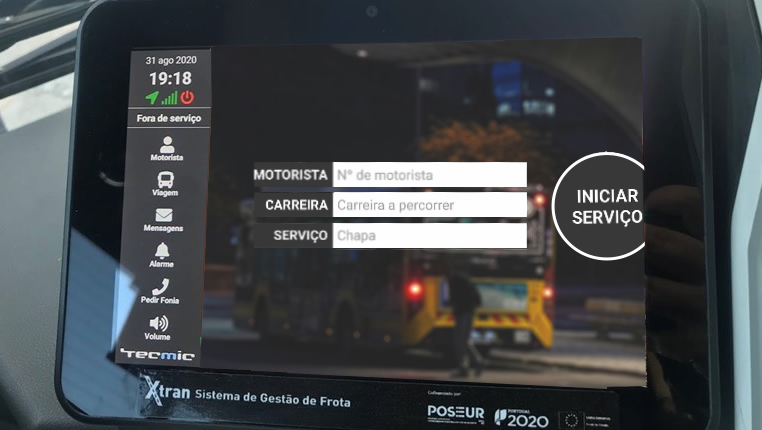
Dataset from XTraN, the operational assistance system used by Carris
👮♀️ Controllers


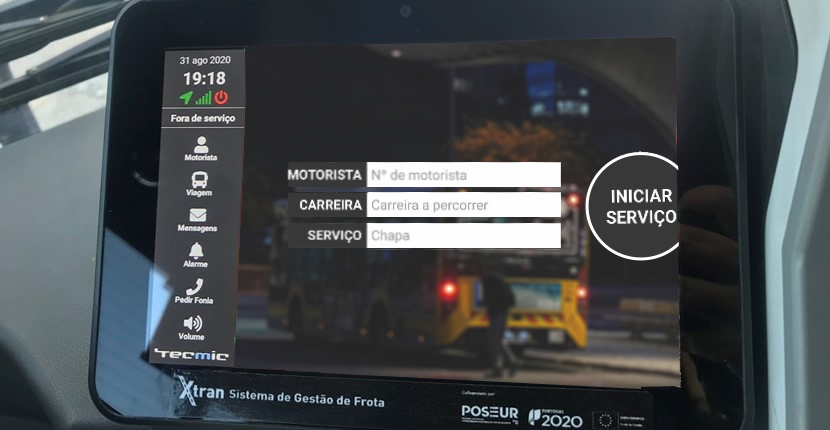
🧑✈️ Drivers
3. Methodology
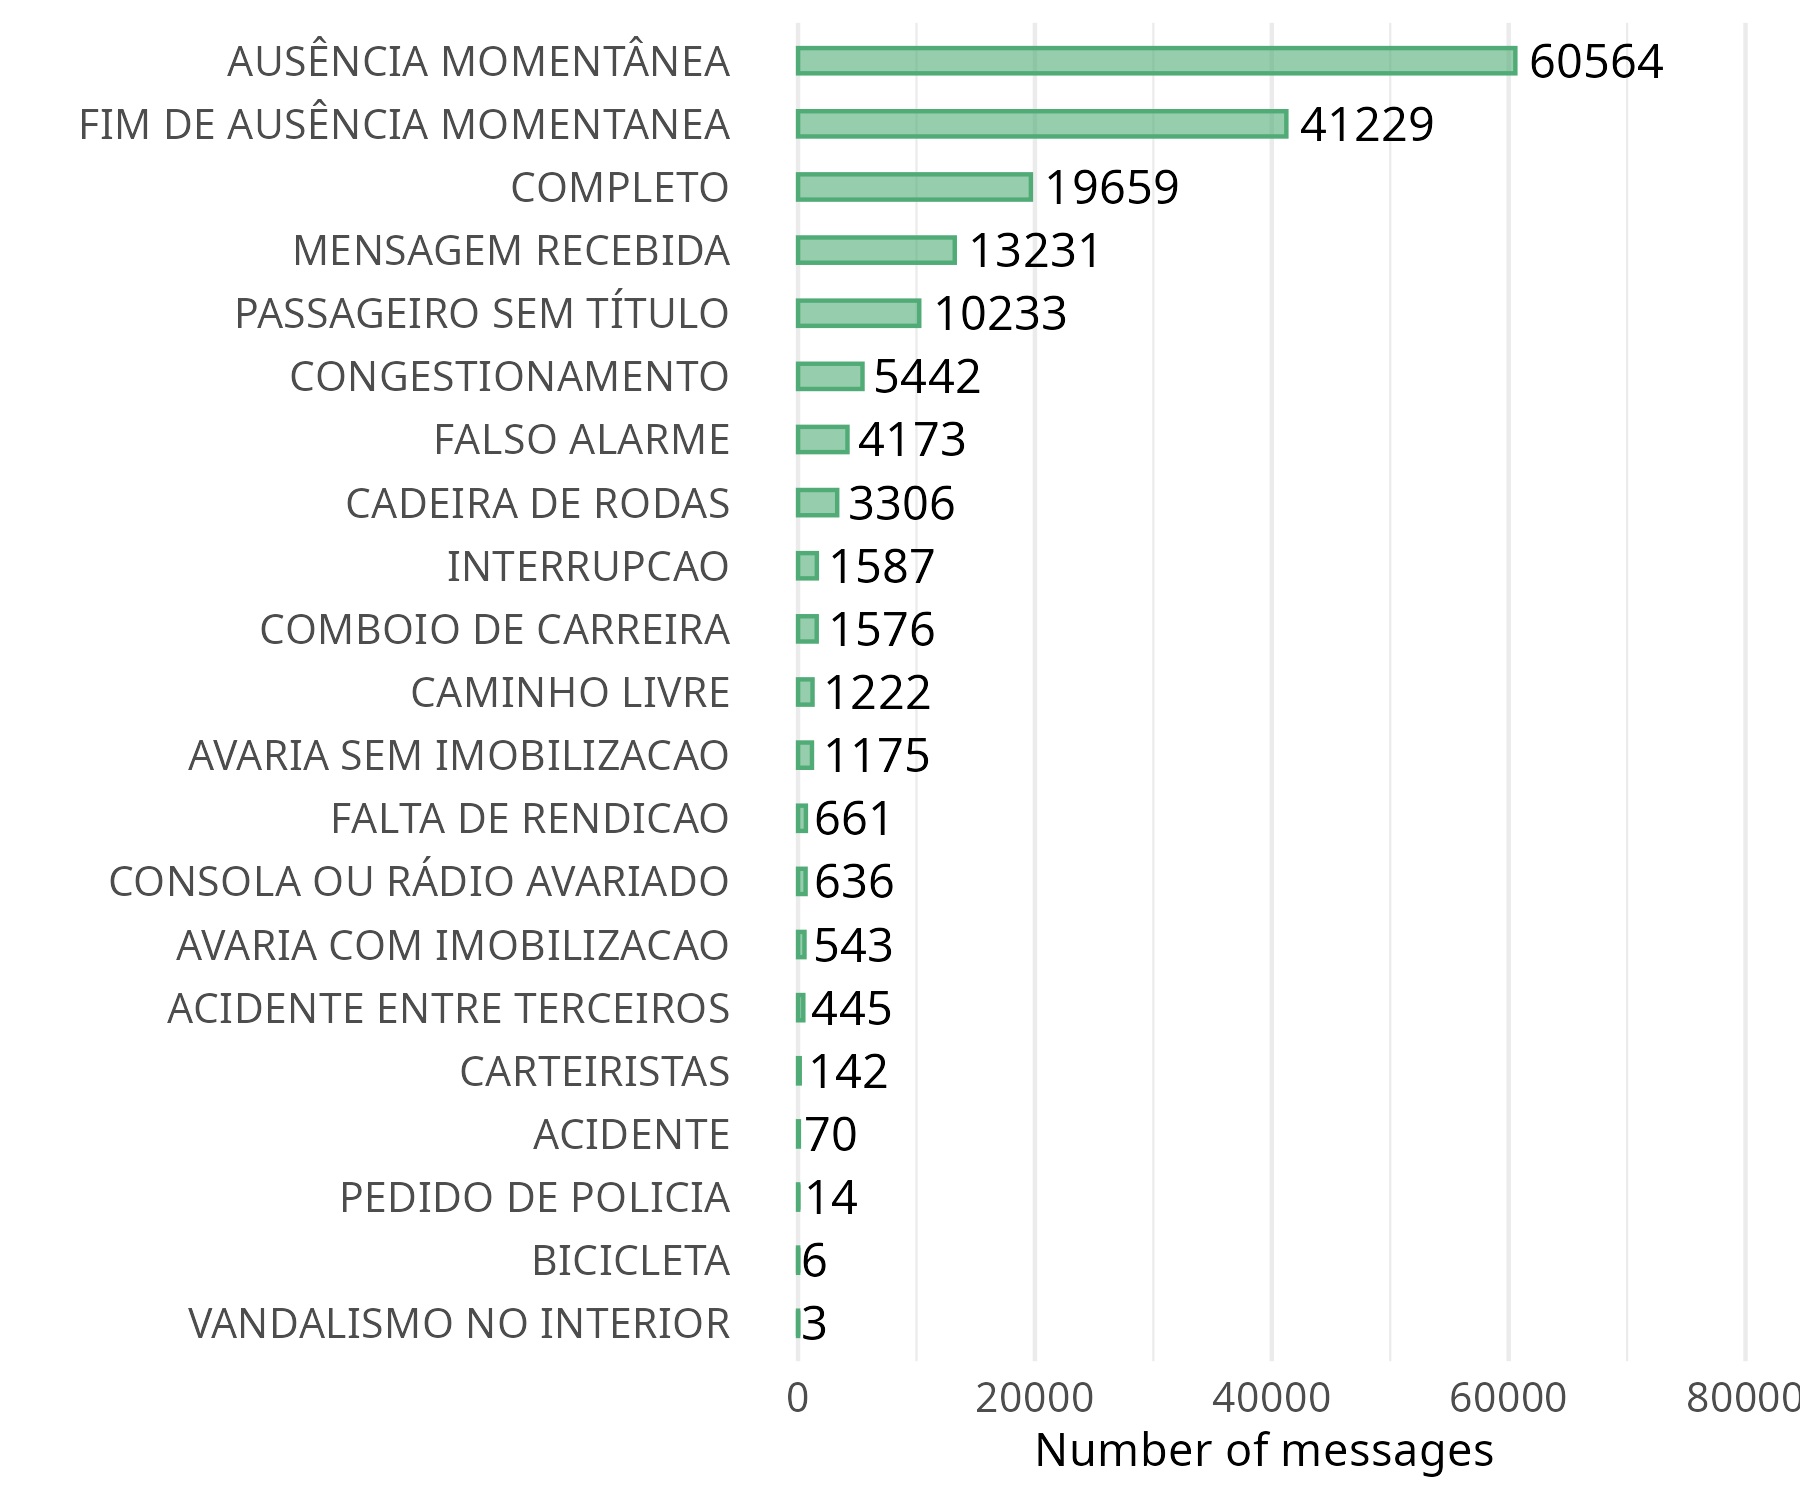
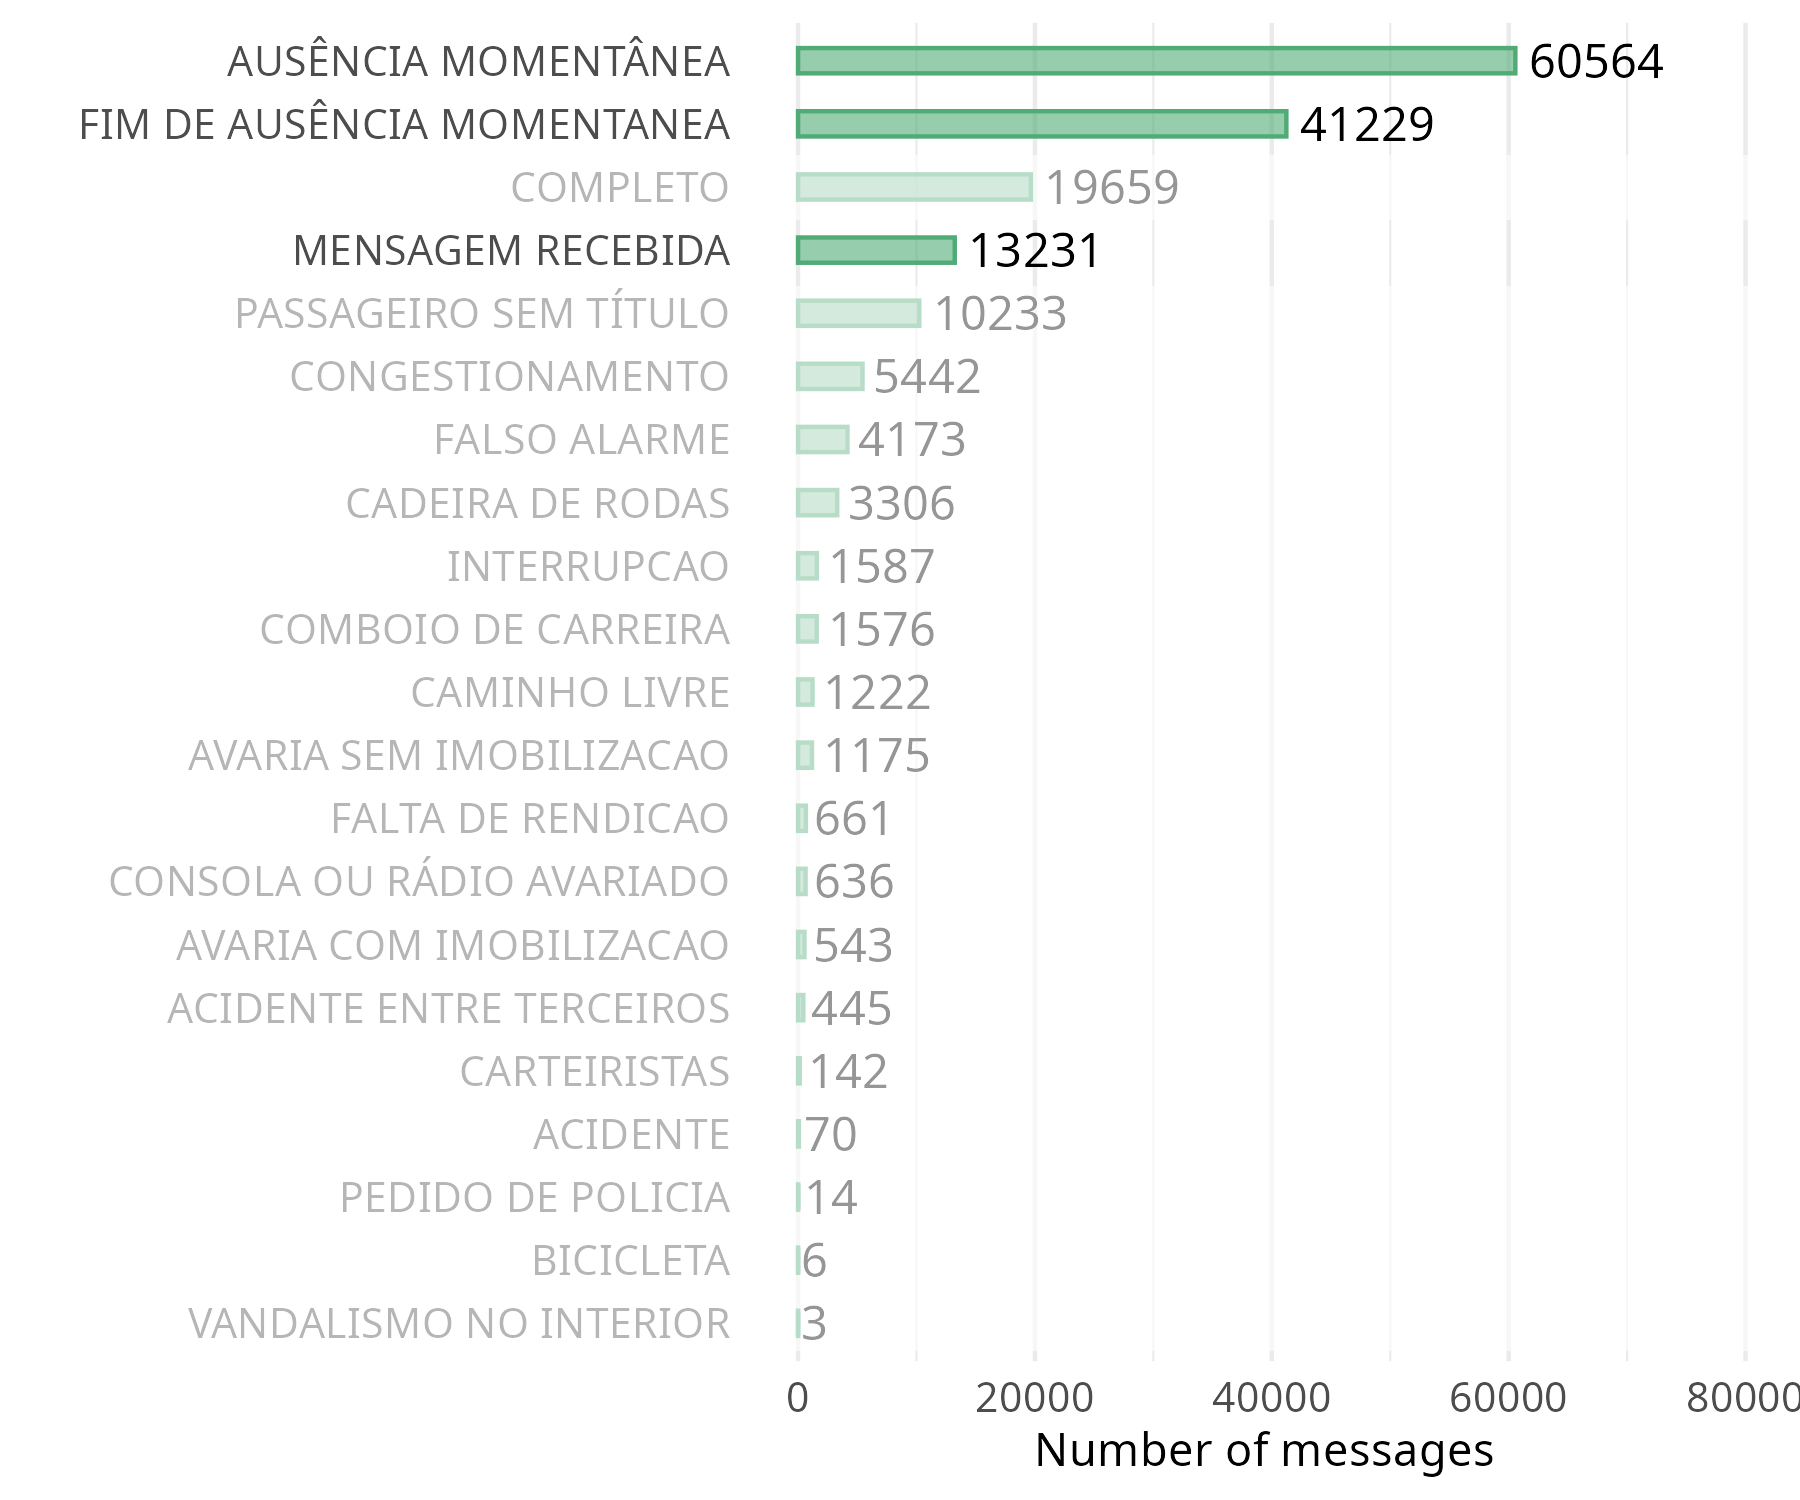
![]() Exploratory Data Analysis: Messages
Exploratory Data Analysis: Messages
Text communication between drivers (on-board tablet) and controllers (Operational Control Center)
📅 From Jan to May 2025 (132 days) 🖇️️+ 270k records
{
  "DriverMec": "189944",
  "DriverName": null,
  "DriverStationCode": "3739",
  "SenderID": 2937,
  "OperatorName": 23554,
  "OriginType": 1,
  "GeometryPoint": "{\"type\":\"Point\",\"coordinates\":[-9.1473,38.74355]}",
  "GpsQuality": 3,
  "Id": 9736723,
  "Date": "/Date(1749431120000)/",
  "ProcessedDate": "/Date(1749431130883)/",
  "VehicleNumber": 796,
  "VehiclePlate": "",
  "BusNumber": 1761,
  "RouteNumber": "207",
  "PlateNumber": "1Z207",
  "PlateNumberText": "207-1",
  "MessageText": "ACIDENTE ENTRE TERCEIROS",
  "Status": 4,
  "FirmGroup": null,
  "FontColor": "#2b2b2b",
  "BackgroundColor": "#d9cbfb"
}
3. Methodology
![]() Exploratory Data Analysis: Messages
Exploratory Data Analysis: Messages
🧑✈️ 2.78 messages per driver/day (SD = 2.35)
3. Methodology
![]() Exploratory Data Analysis: Messages
Exploratory Data Analysis: Messages
🧑✈️ 2.78 messages per driver/day (SD = 2.35)
67.51% are procedural
3. Methodology
![]() Exploratory Data Analysis: Messages
Exploratory Data Analysis: Messages
🧑✈️ 2.78 messages per driver/day (SD = 2.35)
67.51% are procedural
👮♀️ 61.4% by controllers
3. Methodology
![]() Exploratory Data Analysis: Messages
Exploratory Data Analysis: Messages
🧑✈️ 2.78 messages per driver/day (SD = 2.35)
67.51% are procedural
👮♀️ 61.4% by controllers
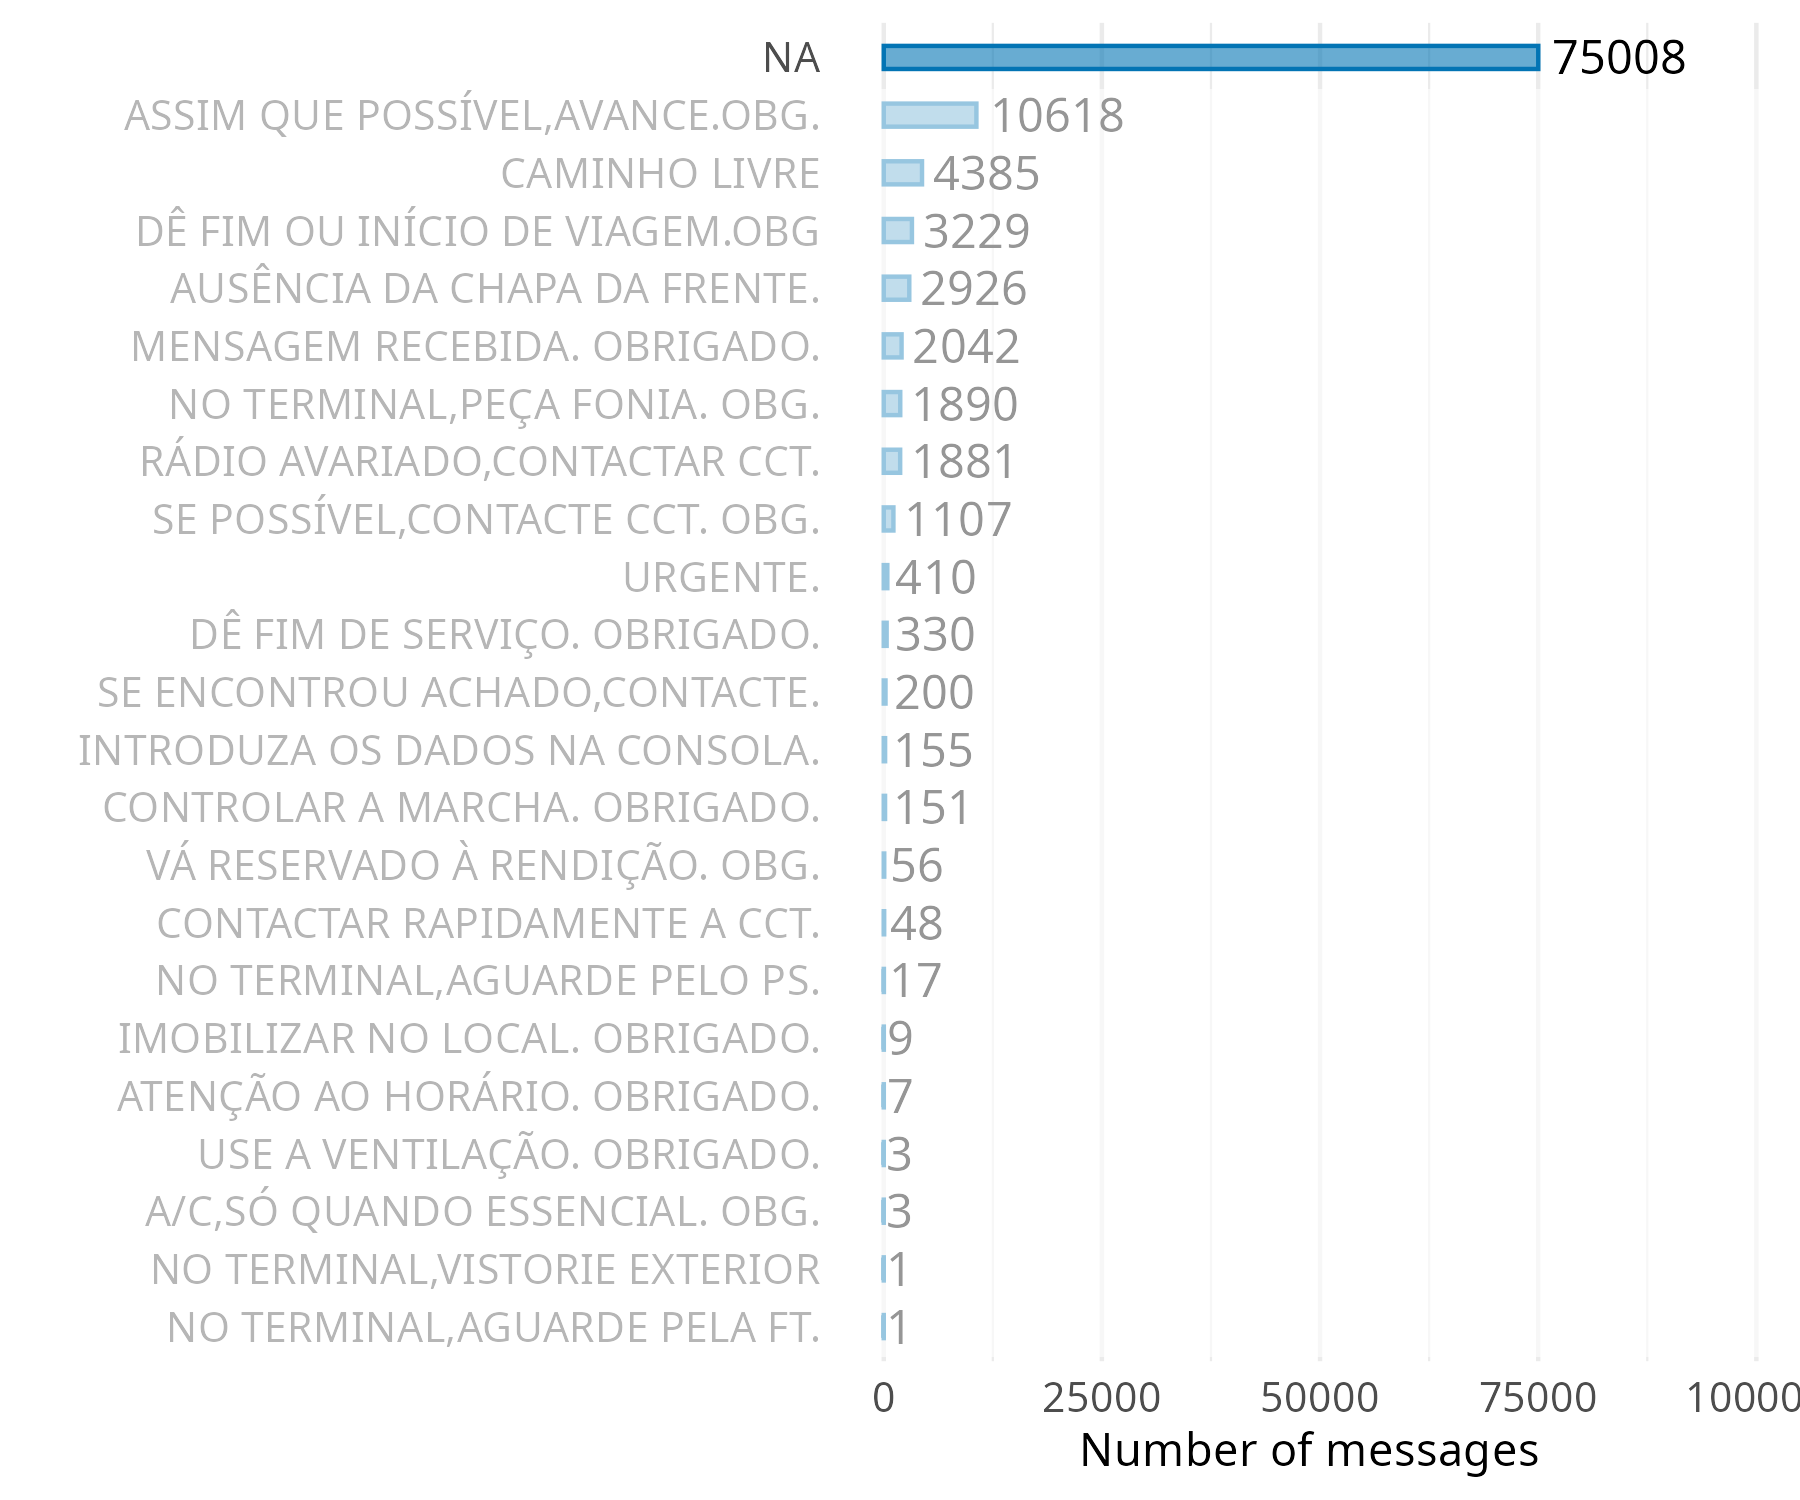
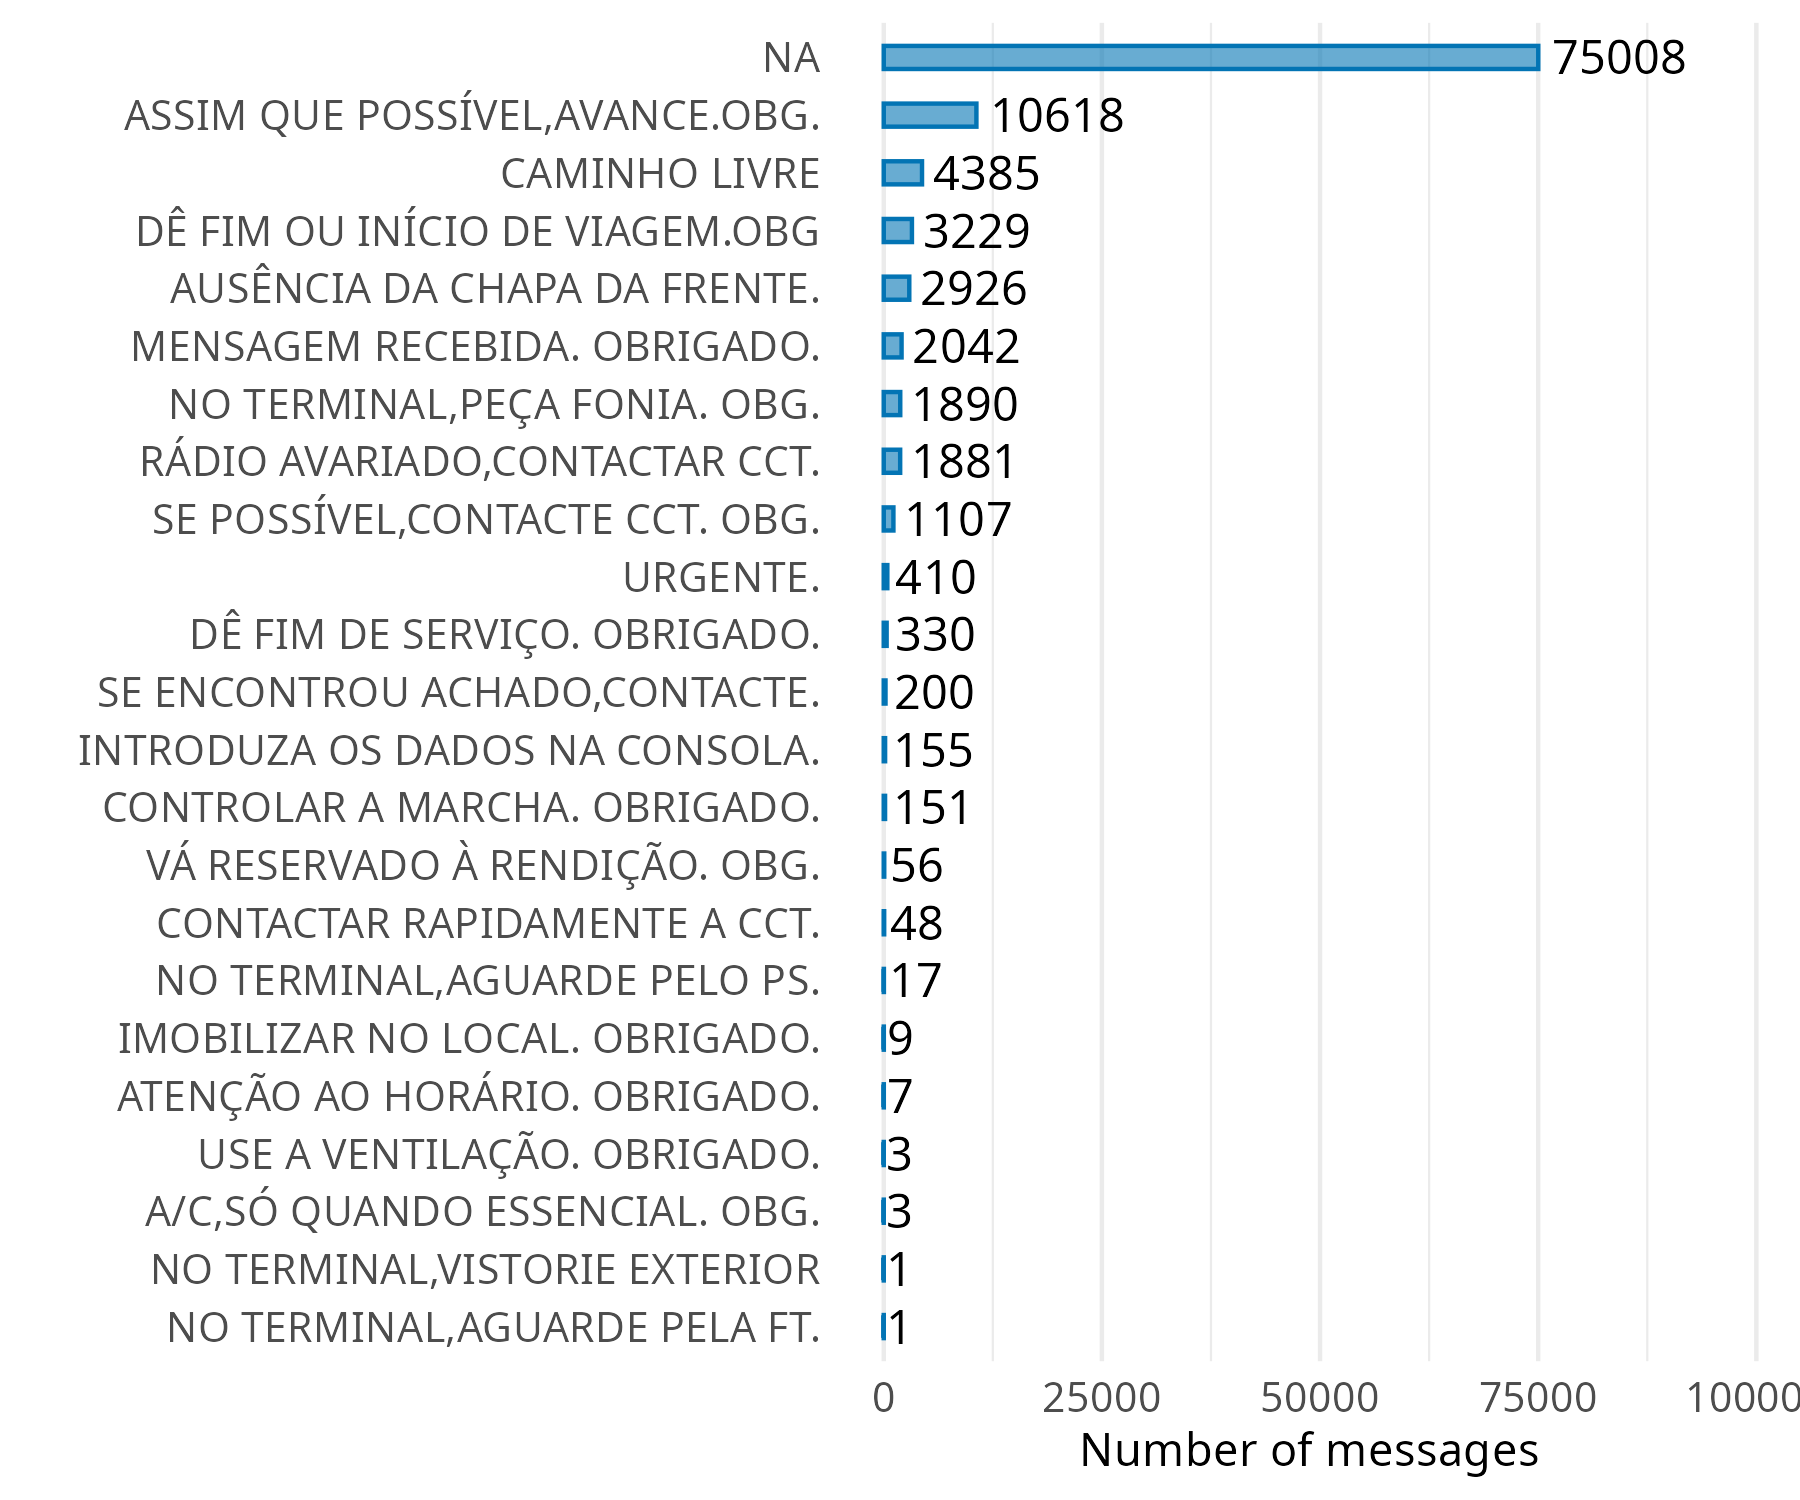
⚠️ 71.8% are free text messages
3. Methodology
![]() Exploratory Data Analysis: Messages
Exploratory Data Analysis: Messages
👮♀️ 61.4% by controllers
⚠️ 71.8% are free text messages

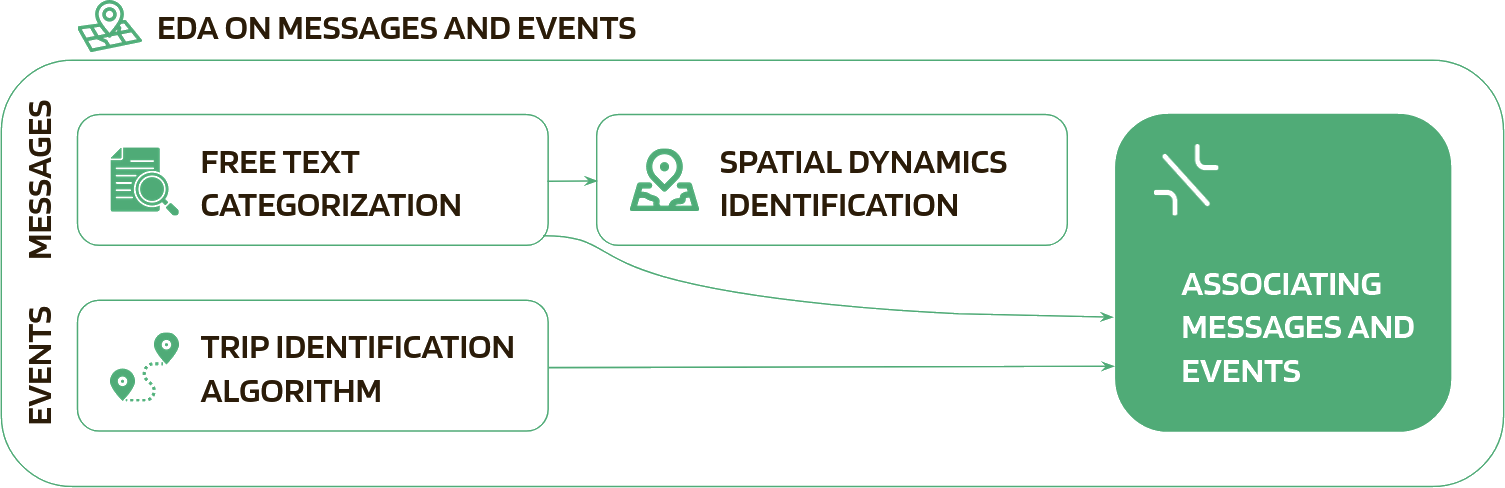
Text mining processing using Latent Dirichlet Allocation topic modeling and bigrams analysis
(adapted from Valença, Moura, and Morais de Sá 2023)


Spatial dynamics of messages categories to reveal geographical and temporal patterns
3. Methodology
![]() Exploratory Data Analysis: Events
Exploratory Data Analysis: Events
Logs of automatic vehicle positions
📅 May 2025 (31 days) 🖇️️+ 32M records
{
  "Id": 2545991349,
  "DriverName": null,
  "DriverMec": "189294",
  "DriverStationCode": "3779",
  "BusNumber": "4627",
  "VehicleNumber": 168,
  "PlateNumber": "4Z736",
  "PlateNumberText": "736-4",
  "RouteNumber": "736",
  "Direction": "DESC",
  "VoyageNumber": 4,
  "TotalKm": 702783,
  "EventTime": "/Date(1749457228000)/",
  "EventReceptionTime": "/Date(1749457291137)/",
  "GpsQuality": 3,
  "Latitude": 38.75392,
  "Longitude": -9.15257,
  "Speed": 14,
  "BusStopNumber": 5704,
  "Description": "Detectada a paragem Campo Grande - Av. Brasil"
}
⚠️ Normalization issues

Algorithm to identify events associated to each trip planned
3. Methodology
![]() Exploratory Data Analysis
Exploratory Data Analysis
4. Empirical Findings and
Thematic Analysis
4. Empirical Findings and Thematic Analysis
![]() State-of-the-Practice
State-of-the-Practice
Interviews with controllers from 4 cities
Lisbon 🇵🇹

Porto 🇵🇹

Braga 🇵🇹

Portland 🇺🇸

4. Empirical Findings and Thematic Analysis
![]() State-of-the-Practice
State-of-the-Practice
3/4 use on-board operational assistance systems
Portland presents most comprehensive setup
Portland reports highest engagement
4. Empirical Findings and Thematic Analysis
![]() State-of-the-Practice
State-of-the-Practice
3/4 use on-board operational assistance systems
Portland presents most comprehensive setup
Portland reports highest engagement
All value previous driving experience for controller recruiting
Only Lisbon and Portland report structured participation
Portland provides feedback through interactive dashboard
None reported to include drivers in planning team
Most have channels for driver input
Portland stands out with direct channel
Overall, drivers’ experience is recognized as valuable, but structured inclusion of their knowledge in monitoring and planning remains limited in Portugal 🇵🇹
![]()
4. Empirical Findings and Thematic Analysis
![]() Focus Group Thematic Analysis
Focus Group Thematic Analysis
18 codes, grouped in 6 categories


4. Empirical Findings and Thematic Analysis
![]() Focus Group Thematic Analysis
Focus Group Thematic Analysis
![]() Connect passengers from A to B on time, with comfort, safety and no complaints
Connect passengers from A to B on time, with comfort, safety and no complaints
![]() Drivers miss guidance on how to balance competing objectives
Drivers miss guidance on how to balance competing objectives
![]() Factor improves operational performance |
Factor improves operational performance | ![]() Factor damages operational performance
Factor damages operational performance
4. Empirical Findings and Thematic Analysis
![]() Focus Group Thematic Analysis
Focus Group Thematic Analysis
 Illegal parking
 ![]()
 Bus lanes and stops occupied by ride-hailing and private vehicles
 ![]()
 Touristic pressure
 ![]()
![]() Factor improves operational performance |
Factor improves operational performance | ![]() Factor damages operational performance
Factor damages operational performance
4. Empirical Findings and Thematic Analysis
![]() Focus Group Thematic Analysis
Focus Group Thematic Analysis
 XTraN lacks updates, feedback and conection reliability
 ![]()
 Highway patrol discourages road code infractions
 ![]()
![]() Factor improves operational performance |
Factor improves operational performance | ![]() Factor damages operational performance
Factor damages operational performance
4. Empirical Findings and Thematic Analysis
![]() Focus Group Thematic Analysis
Focus Group Thematic Analysis
 Unrealistic schedules (traffic, urban changes, touristic demand)
 ![]()
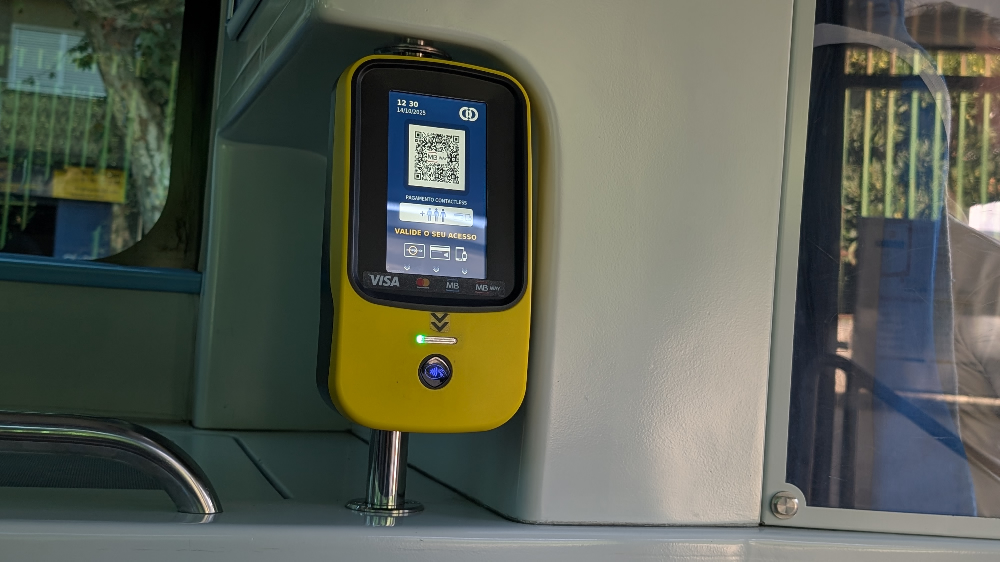 Ticketing improvements with contactless
 ![]()
![]() Factor improves operational performance |
Factor improves operational performance | ![]() Factor damages operational performance
Factor damages operational performance
4. Empirical Findings and Thematic Analysis
![]() Focus Group Thematic Analysis
Focus Group Thematic Analysis
 Network outdated with urban development + missing toilets
 ![]()
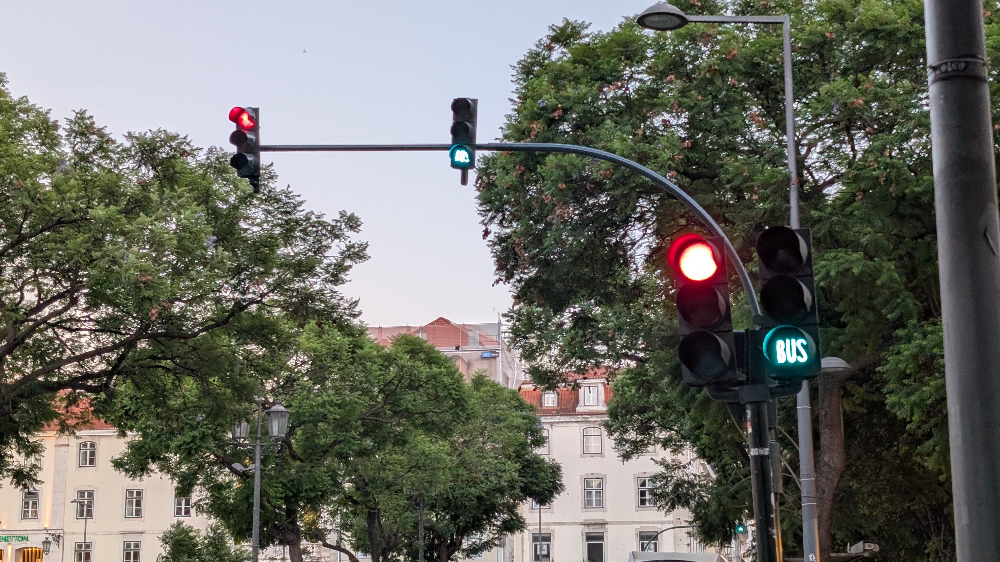 Intersections and traffic lights as bottlenecks
 ![]()
 Unattractive career
 ![]()
![]() Factor improves operational performance |
Factor improves operational performance | ![]() Factor damages operational performance
Factor damages operational performance
4. Empirical Findings and Thematic Analysis
![]() Focus Group Thematic Analysis
Focus Group Thematic Analysis
![]() Drivers express pride in Carris mission and their role
Drivers express pride in Carris mission and their role
![]() But also a sense of not being considered in decisions processes
But also a sense of not being considered in decisions processes
![]() Factor improves operational performance |
Factor improves operational performance | ![]() Factor damages operational performance
Factor damages operational performance
4. Empirical Findings and Thematic Analysis
![]() Focus Group Thematic Analysis
Focus Group Thematic Analysis
Drivers tacit knowledge goes beyond their functional role and hold valuable
system-wide perspectives

Potential to complement explicit knowledge of planners
![]()
4. Empirical Findings and Thematic Analysis
![]() Comparing Findings With Previous Studies
Comparing Findings With Previous Studies
Results are aligned with the literature
| Factor | Subfactor | Source |
| Weather | Impact on operations | 📖 👥 |
| Other vehicles | Traffic | 📖 👥 |
| Passengers | Irregular loads; Traveler behaviour | 📖 👥 |
| Service planning | Network design; Schedule quality | 📖 👥 |
| Vehicle | Modernization | 📖 👥 |
| Stop design | Location; Traffic flow segregation; Number of berths | 📖 👥 |
| Stop operation | Boarding conditions; Schedule design; Traffic lights; Payment system | 📖 👥 |
| Bus lane | Impacts; Design | 📖 👥 |
| Drivers | Experience; Stress; Fatigue and drowsiness | 📖 👥 |
📖 Literature Review | 👥 Focus Group
4. Empirical Findings and Thematic Analysis
![]() Comparing Findings With Previous Studies
Comparing Findings With Previous Studies
Results are aligned with the literature and extend it
| Factor | Subfactor | Source |
| Weather | Impact on operations | 📖 👥 |
| Other vehicles | Traffic | 📖 👥 |
| Passengers | Irregular loads; Traveler behaviour | 📖 👥 |
| Service planning | Network design; Schedule quality | 📖 👥 |
| Vehicle | Modernization | 📖 👥 |
| Stop design | Location; Traffic flow segregation; Number of berths | 📖 👥 |
| Stop operation | Boarding conditions; Schedule design; Traffic lights; Payment system | 📖 👥 |
| Bus lane | Impacts; Design | 📖 👥 |
| Drivers | Experience; Stress; Fatigue and drowsiness | 📖 👥 |
| Service operation | Operating assistance system; Enforcement | ➖👥 |
| Governance | Working conditions; Company commitment on stakeholder engagement | ➖👥 |
📖 Literature Review | 👥 Focus Group
5. Operational Data
Analysis Outcomes
5. Operational Data Analysis Outcomes
![]() Free Text Messages Categorization
Free Text Messages Categorization
Text mining identified 7 new categories and mapped to 7 pre-existing ones
⚠️ 71.8% are free text messages
64,522 re-categorized
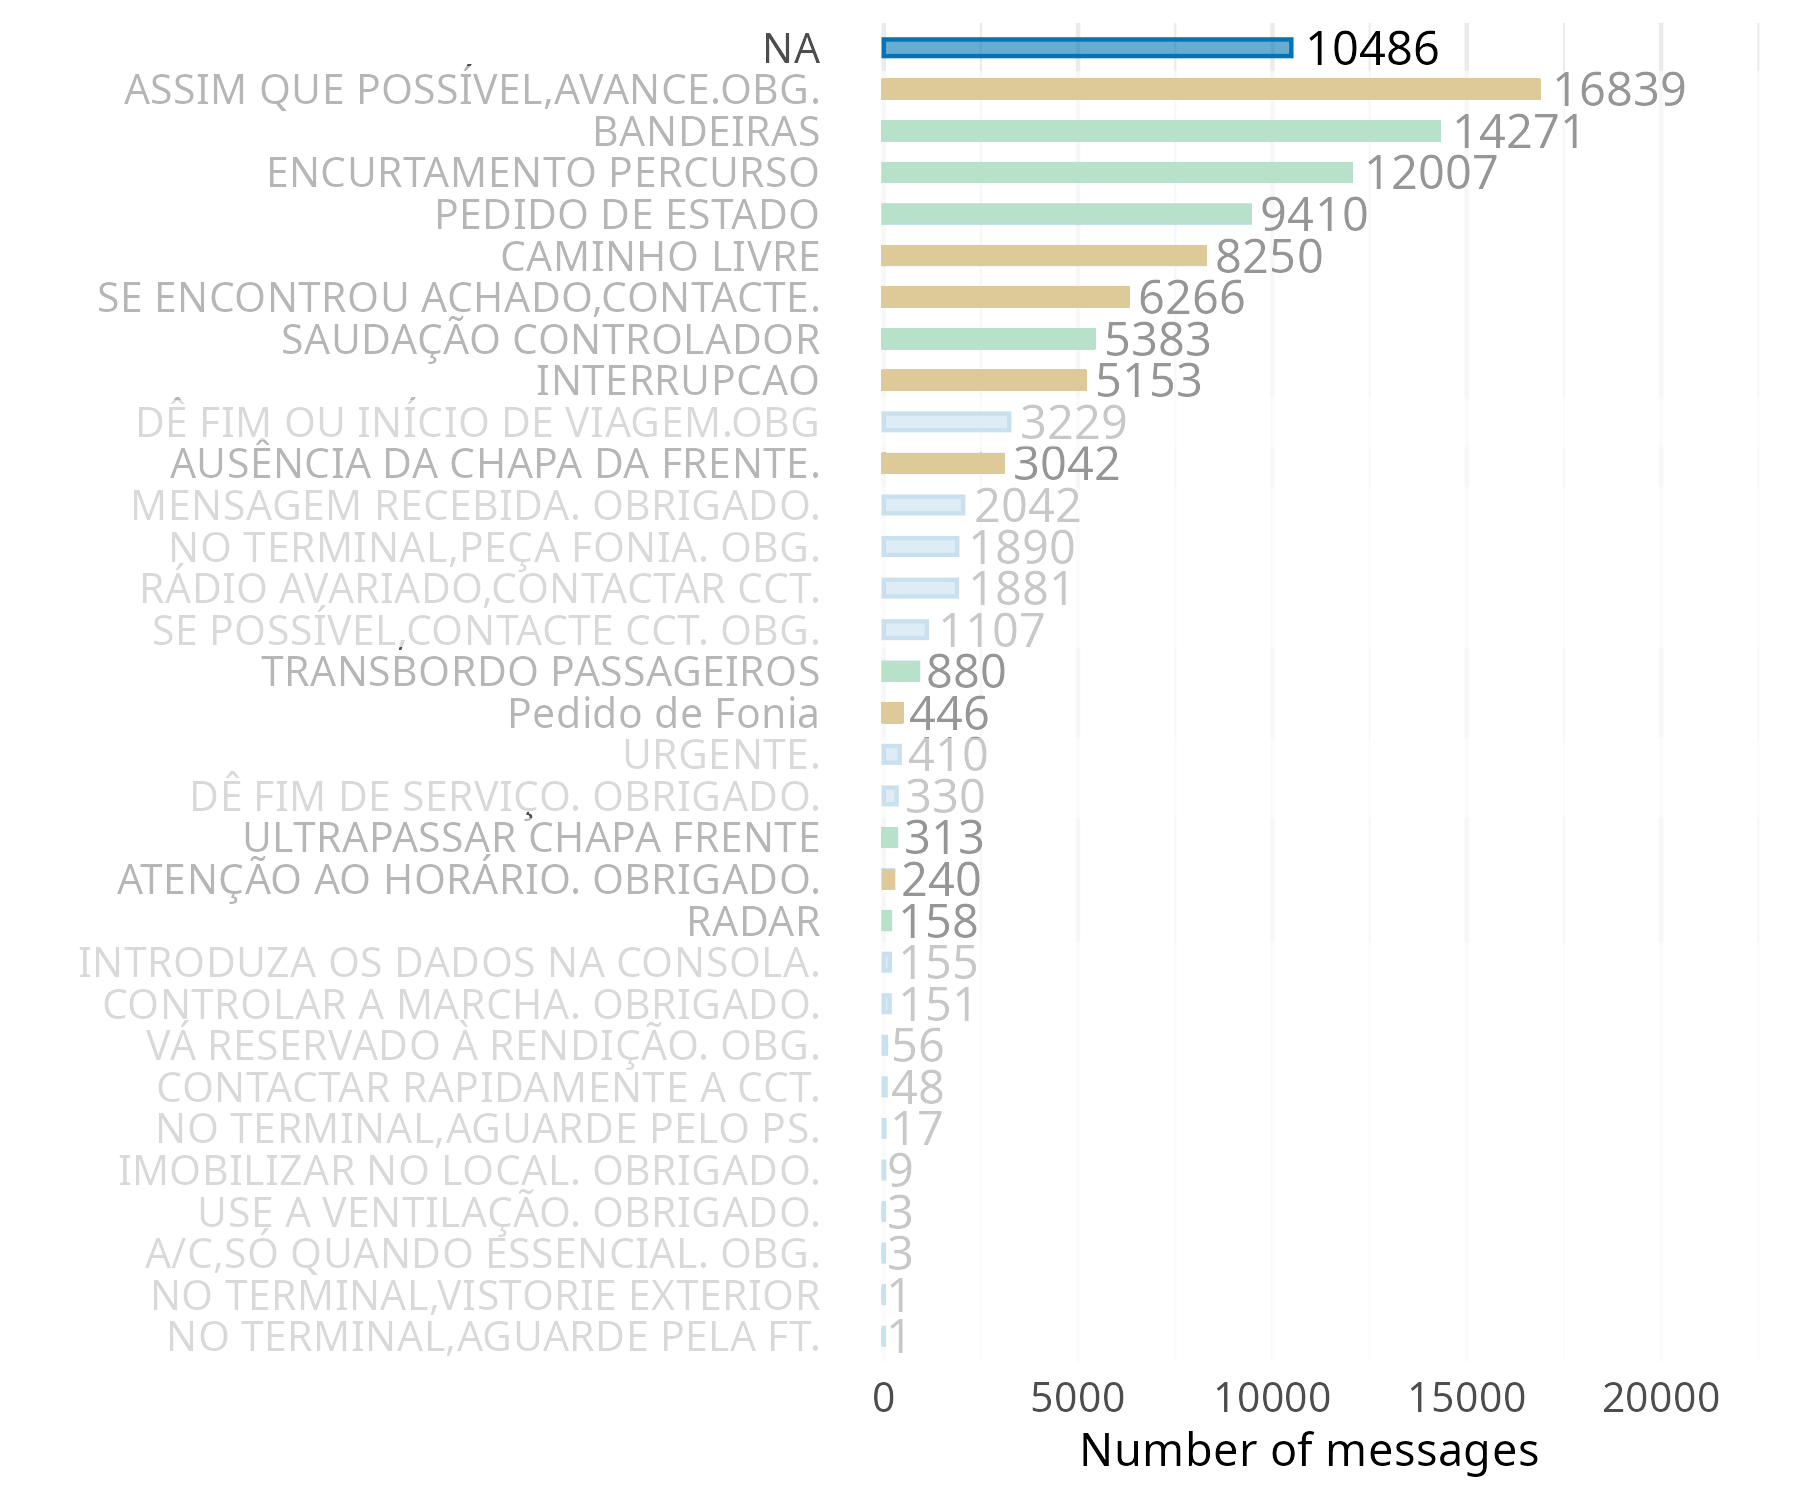
10% free text messages
5. Operational Data Analysis Outcomes
![]() Free Text Messages Categorization
Free Text Messages Categorization
Text mining identified 7 new categories and mapped to 7 pre-existing ones
⚠️ 71.8% are free text messages
64,522 re-categorized
10% free text messages
Suggests that XTraN system is misaligned with operational needs
![]()
5. Operational Data Analysis Outcomes
![]() Messages Spatial Dynamics
Messages Spatial Dynamics
5. Operational Data Analysis Outcomes
![]() Messages Spatial Dynamics
Messages Spatial Dynamics
Wheelchair passengers 🦽
5. Operational Data Analysis Outcomes
![]() Messages Spatial Dynamics
Messages Spatial Dynamics
Wheelchair passengers 🦽
5. Operational Data Analysis Outcomes
![]() Messages Spatial+Temporal Dynamics
Messages Spatial+Temporal Dynamics
Full bus 👥
Ticket fraud 🚨
5. Operational Data Analysis Outcomes
![]() Messages Spatial+Temporal Dynamics
Messages Spatial+Temporal Dynamics
Full bus 👥
Ticket fraud 🚨
There is a high potential to convert tacit observations into explicit knowledge to support decision-making
![]()
5. Operational Data Analysis Outcomes
![]() Linking Messages to Trip Performance
Linking Messages to Trip Performance
Considering average values, in minutes
| Message | N | Departure delay | Travel time diff | Arrival delay |
|---|---|---|---|---|
| Full | 6621 | 0.3 | 3.4 | 3.7 |
| Proceed | 2606 | -0.1 | 2.1 | 2.0 |
| Short turning | 2043 | -0.3 | 5.8 | 5.5 |
| Traffic | 1782 | 0.4 | 4.6 | 4.9 |
| Overtake | 173 | 0.4 | -0.3 | 0.1 |
| Crash | 167 | 0.5 | 3.5 | 4.0 |
| Schedule warning | 61 | -0.4 | 3.4 | 3.0 |
| Control driving | 52 | -0.7 | -4.2 | -5.0 |
| Reserved | 4 | 0.5 | 4.0 | 4.5 |
Most categories tend to be sent during trips that take longer than scheduled
Delayed arrivals are related to traffic, crashes, crowding, reserved and short turns
Overtake seems to be effective on restoring schedule regularity, unlike control driving
5. Operational Data Analysis Outcomes
![]() Linking Messages to Trip Performance
Linking Messages to Trip Performance
Considering average values, in minutes
| Message | N | Departure delay | Travel time diff | Arrival delay |
|---|---|---|---|---|
| Full | 6621 | 0.3 | 3.4 | 3.7 |
| Proceed | 2606 | -0.1 | 2.1 | 2.0 |
| Short turning | 2043 | -0.3 | 5.8 | 5.5 |
| Traffic | 1782 | 0.4 | 4.6 | 4.9 |
| Overtake | 173 | 0.4 | -0.3 | 0.1 |
| Crash | 167 | 0.5 | 3.5 | 4.0 |
| Schedule warning | 61 | -0.4 | 3.4 | 3.0 |
| Control driving | 52 | -0.7 | -4.2 | -5.0 |
| Reserved | 4 | 0.5 | 4.0 | 4.5 |
Messages patterns could be incorporated in automated real-time alarms or responses to enhance operational response time and mitigate impacts of disruptions
![]()
6. Conclusion
6. Conclusion
Main Findings
Results demonstrate that drivers have relevant insights about all planning levels, which can meaningfully contribute to decision making
6. Conclusion
Main Findings
Results demonstrate that drivers have relevant insights about all planning levels, which can meaningfully contribute to decision making

There is an untapped potential to turn experience into organizational knowledge, that can ultimately improve service reliability and overall system performance

REDUCE OP CONSTRAINTS

NEGATIVE IMPROVE PERCEPTION

LOW INCREASE MODAL SHARE
6. Conclusion
Main Findings
Results demonstrate that drivers have relevant insights about all planning levels, which can meaningfully contribute to decision making
There is an untapped potential to turn experience into organizational knowledge, that can ultimately improve service reliability and overall system performance
Technological innovation alone is not sufficient without serious institutional commitment to involve stakeholders and promote continuous improvement
6. Conclusion
Policy recommendations for Carris
- Improve messages categories to meet operational needs
- Improve messages functionality to increase usability
- Incorporate on-board automatic detection of recurring disruptions
- Evolve XTraN from reactive to predictive decision-support tool
- Create structured channels for driver feedback
- Institutional commitment for particited decision framework
![]()
6. Conclusion
Policy recommendations for Carris
- Improve messages categories to meet operational needs
- Improve messages functionality to increase usability
- Incorporate on-board automatic detection of recurring disruptions
- Evolve XTraN from reactive to predictive decision-support tool
- Create structured channels for driver feedback
- Institutional commitment for participated decision framework
![]()
6. Conclusion
Policy recommendations for Carris
- Improve messages categories to meet operational needs
- Improve messages functionality to increase usability
- Incorporate on-board automatic detection of recurring disruptions
- Evolve XTraN from reactive to predictive decision-support tool
- Create structured channels for driver feedback
- Institutional commitment for particited decision framework
![]()
6. Conclusion
Policy recommendations for Carris
- Improve messages categories to meet operational needs
- Improve messages functionality to increase usability
- Incorporate on-board automatic detection of recurring disruptions
- Evolve XTraN from reactive to predictive decision-support tool
- Create structured channels for driver feedback
- Institutional commitment for particited decision framework
![]()
6. Conclusion
Methodological Contributions
Replicable framework to assess how tacit and explicit knowledge coexists within organizations
Code available at gmatosferreira/Through-bus-drivers-eyes
Acknowledgements

Extra
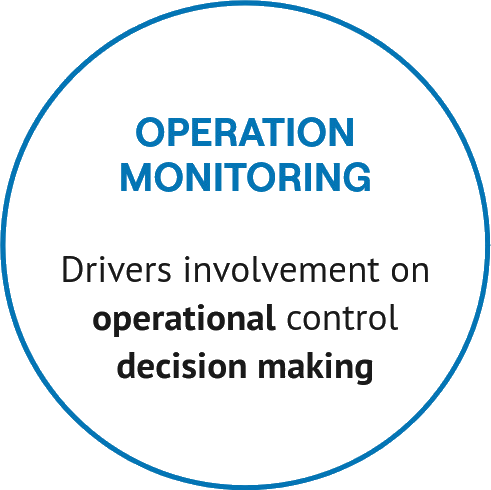
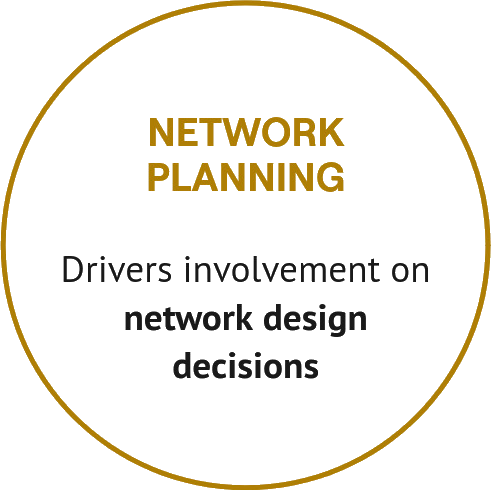
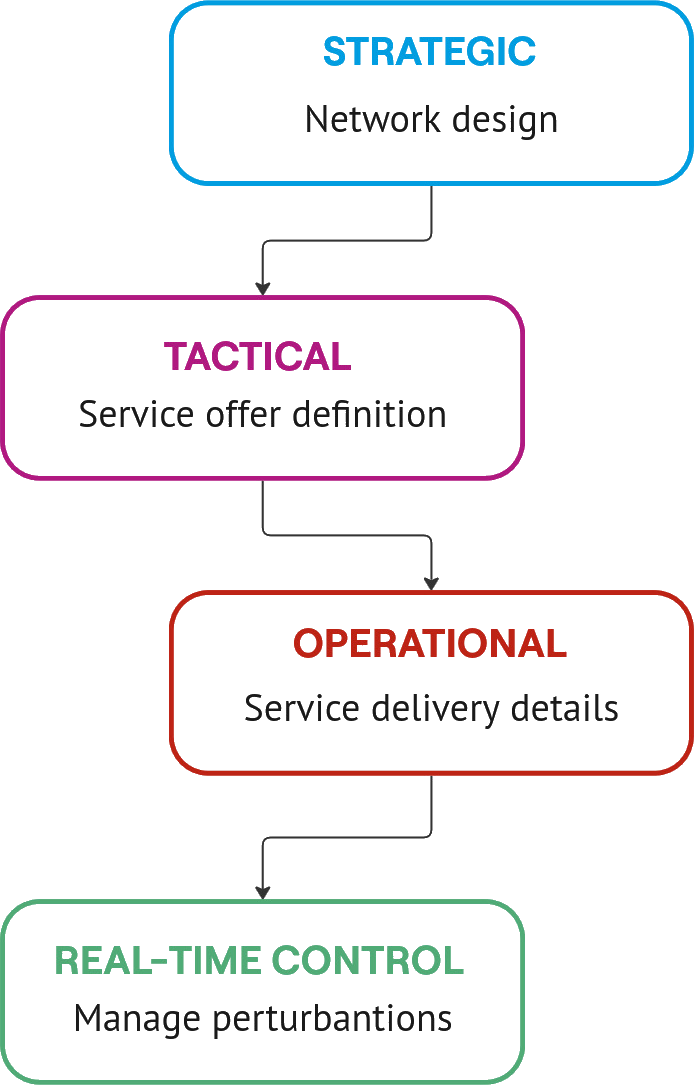
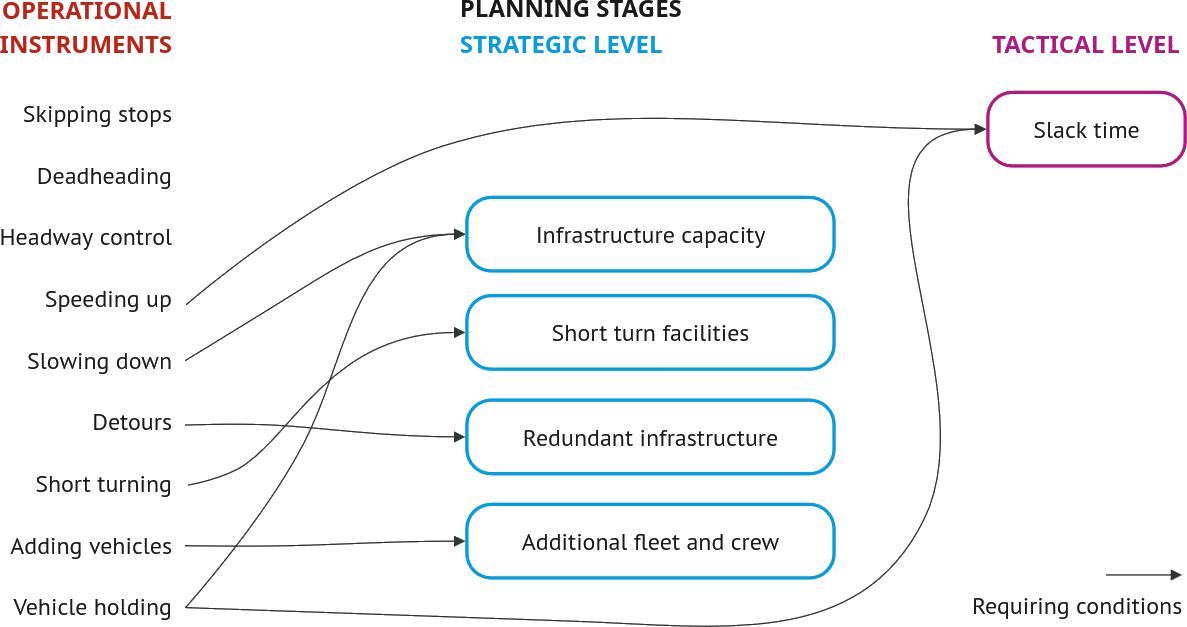
How are bus networks monitored and planned?
Process that covers several management levels with distinct but interconnected goals
Extra
How are bus networks monitored and planned?
Process that covers several management levels with distinct but interconnected goals
Extra
What factors impact performance?
Bus operation takes place inside a complex and dynamic urban system
(Desaulniers and Hickman 2007)
SERVICE PLANNING
VEHICLES
STOP DESIGN
STOP OPERATION
BUS LANES
DRIVERS
URBAN ENVIRONMENT
(Cordera et al. 2024, extended)

Understanding these interactions is essential for an effective planning
Extra
QUATTRO quality loop
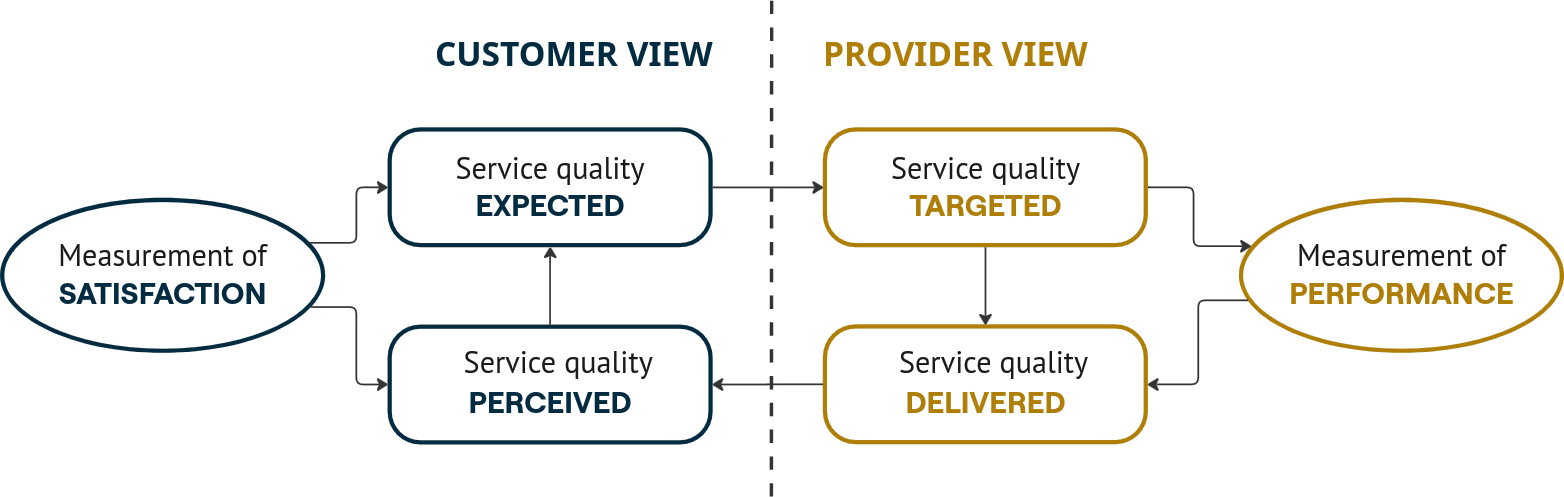
QUATTRO quality loop (Adapted from European Commission 1998; Nakanishi and Kittelson & Associates, Inc 2003)
Extra
Summary and Research Gap
Bus network monitoring and planning is a well-established field of research
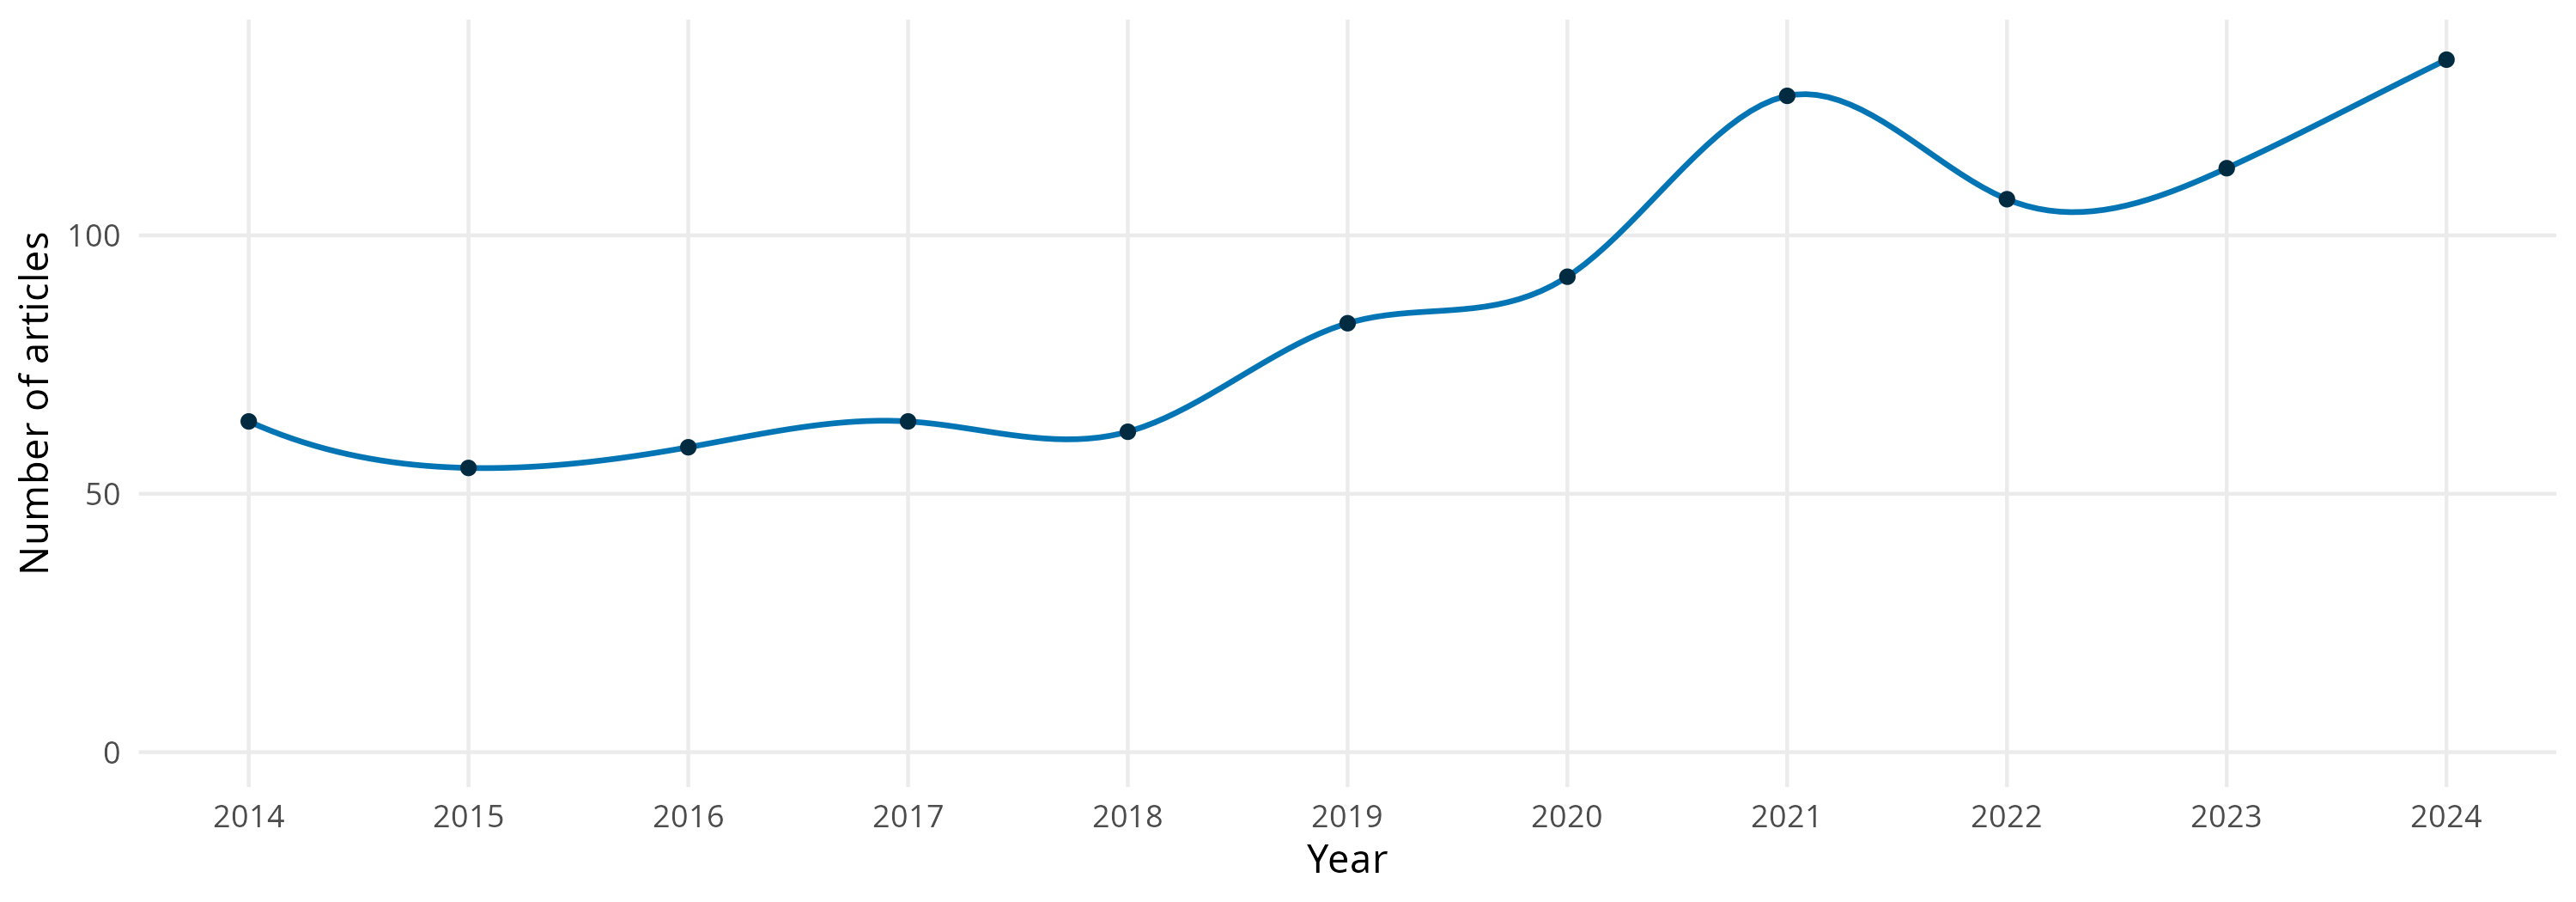
Annual growth rate of literature for bus planning and monitoring on Web Of Science (produced using bibliometrix)
Extra
Summary and Research Gap
Bus network monitoring and planning is a well-established field of research
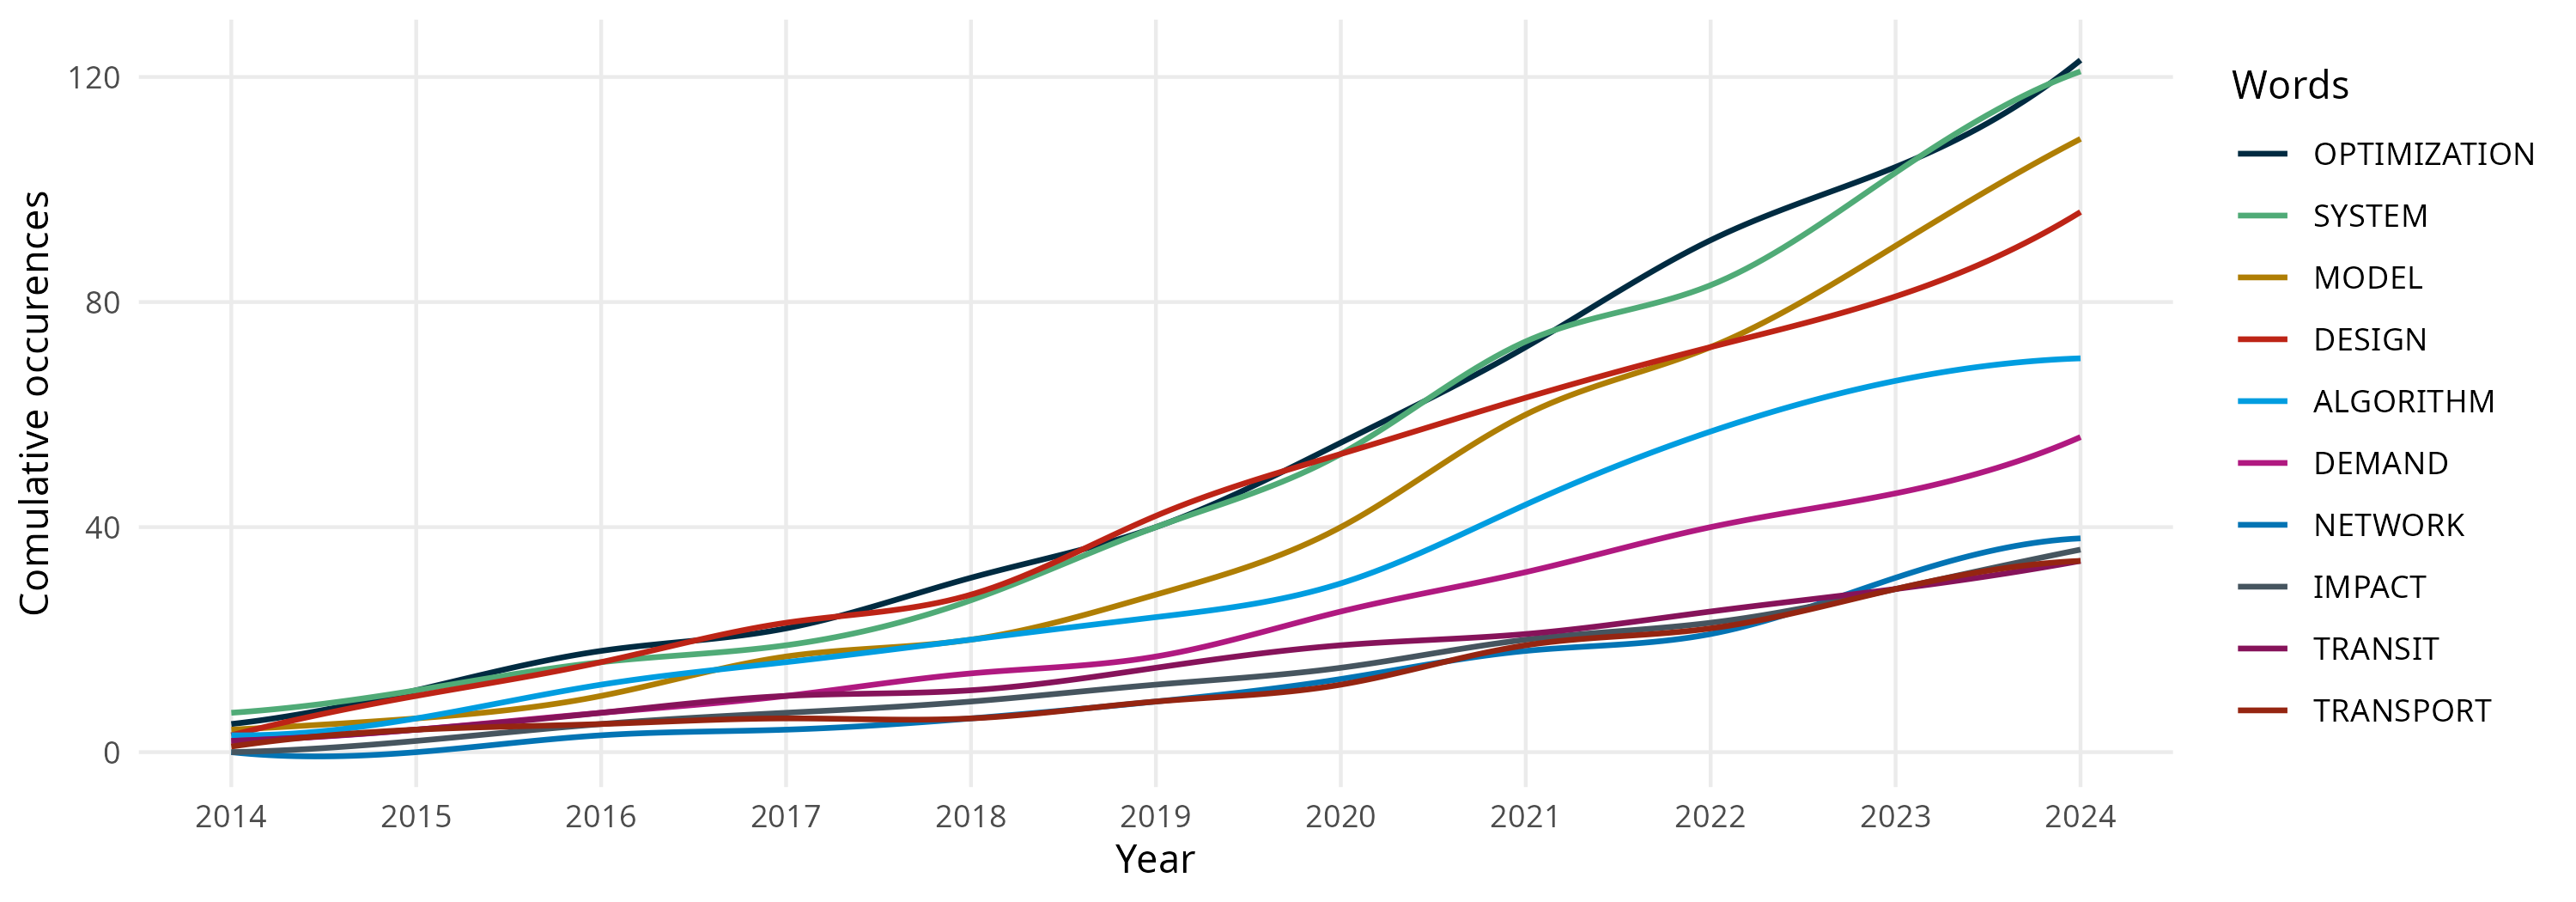
Annual growth rate of literature for bus planning and monitoring on Web Of Science (produced using bibliometrix)
Extra
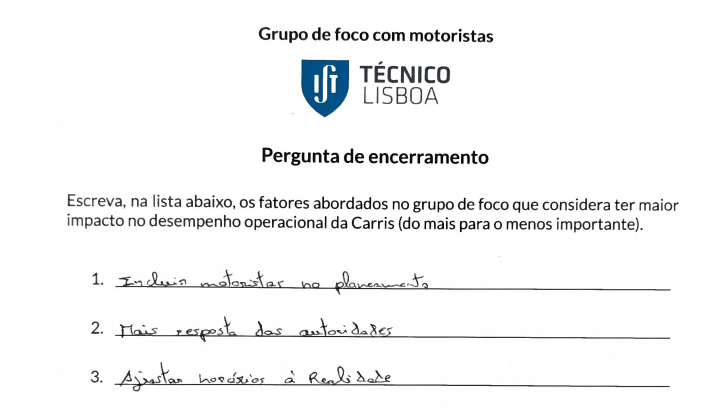
Focus group transcription

turboscribe.ai dashboard for one of the focus group transcripts
Extra
Focus group TA codes
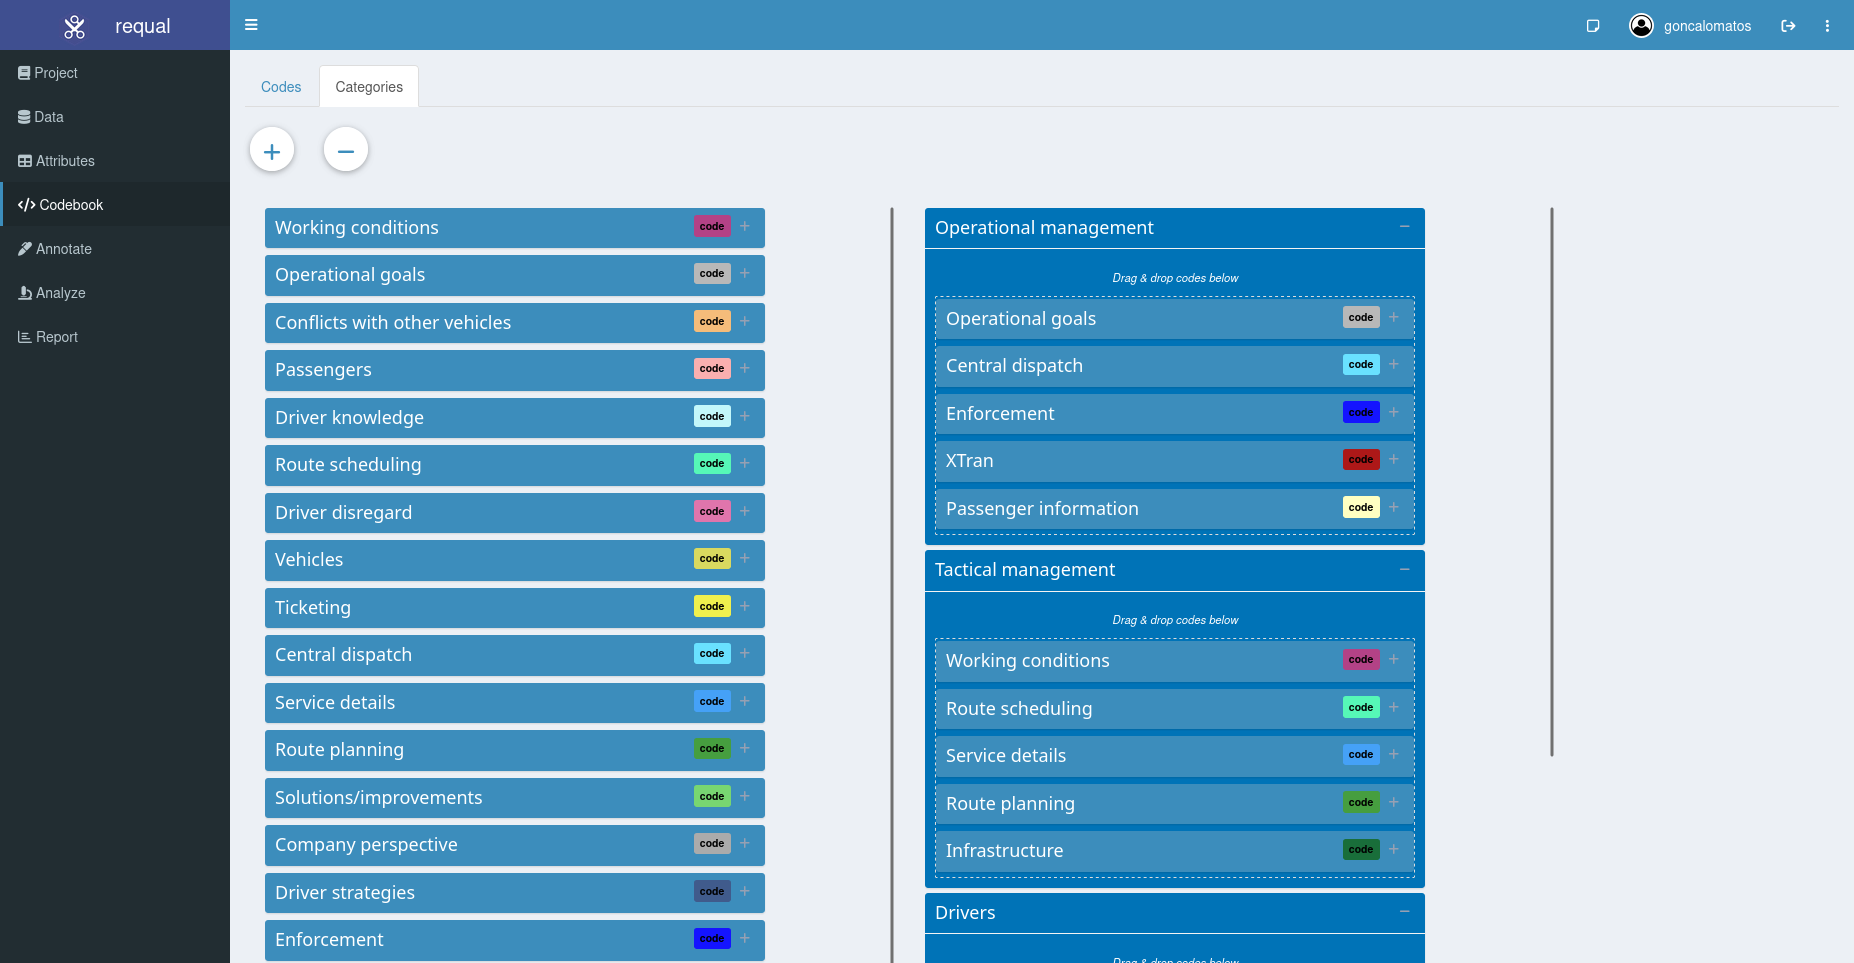
interface for codes and themes management
Extra
Focus group TA manual categorization
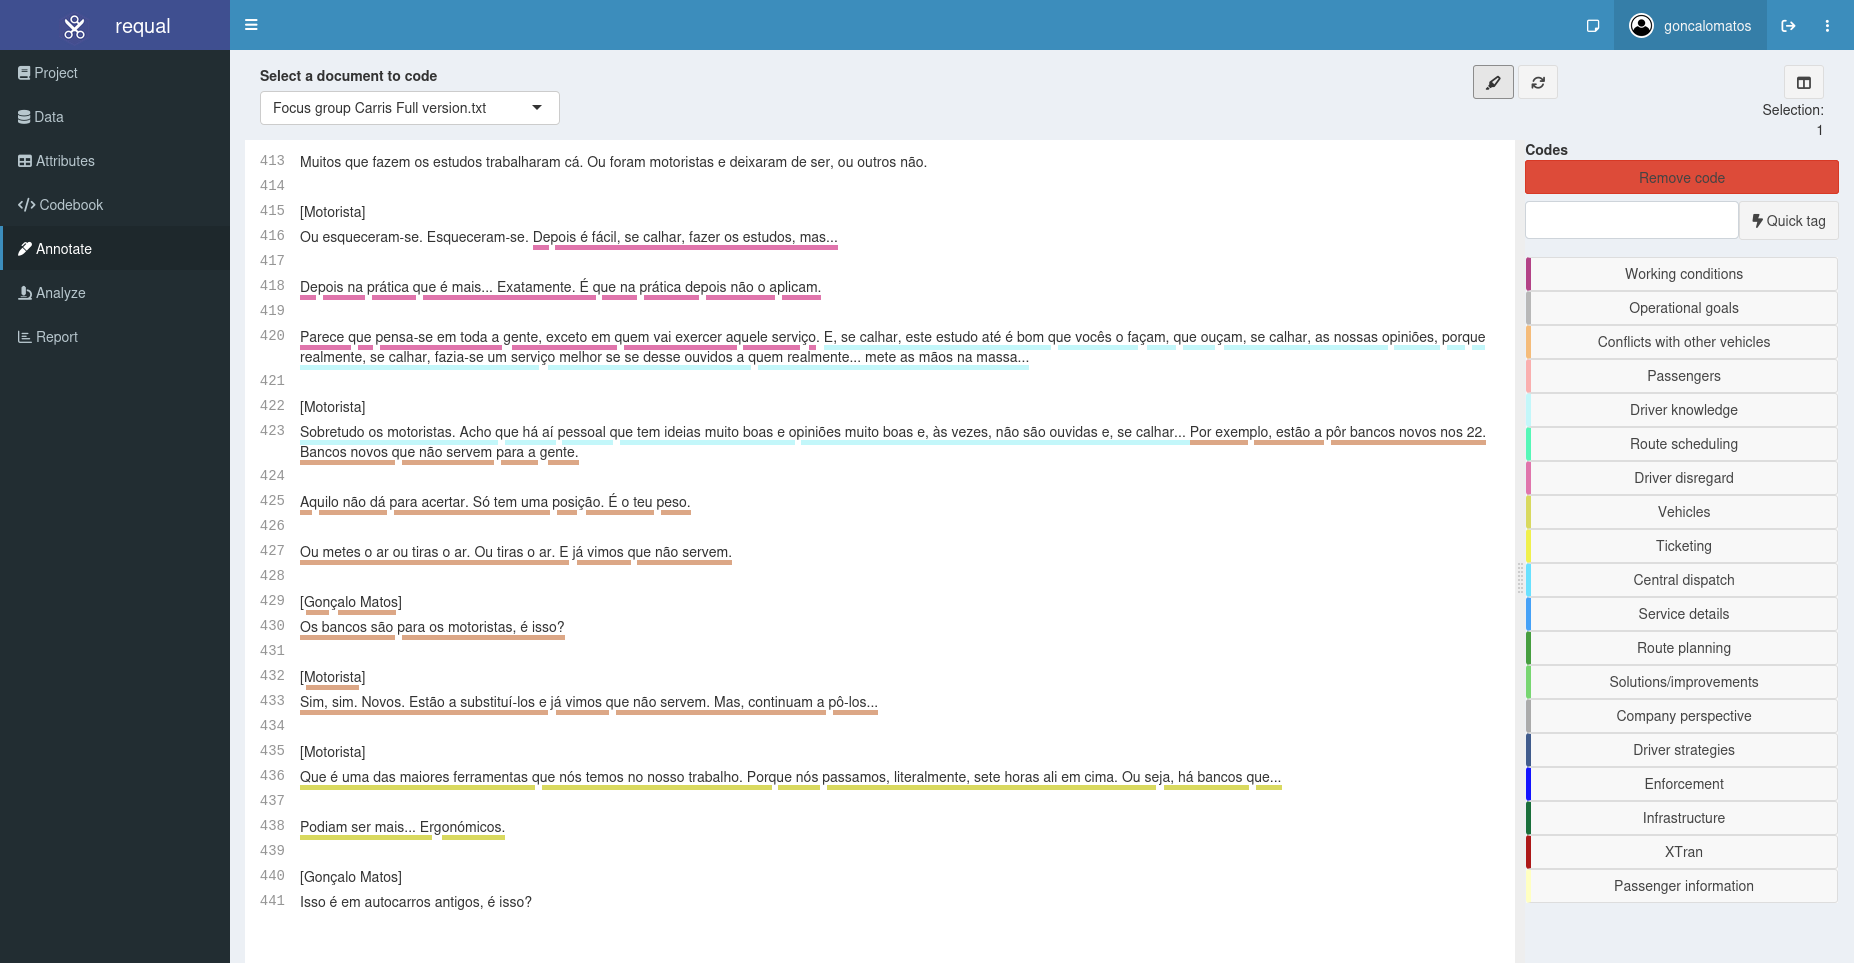
interface for coding textual transcript
Extra
![]() Focus Group Method and Analysis
Focus Group Method and Analysis

Extra
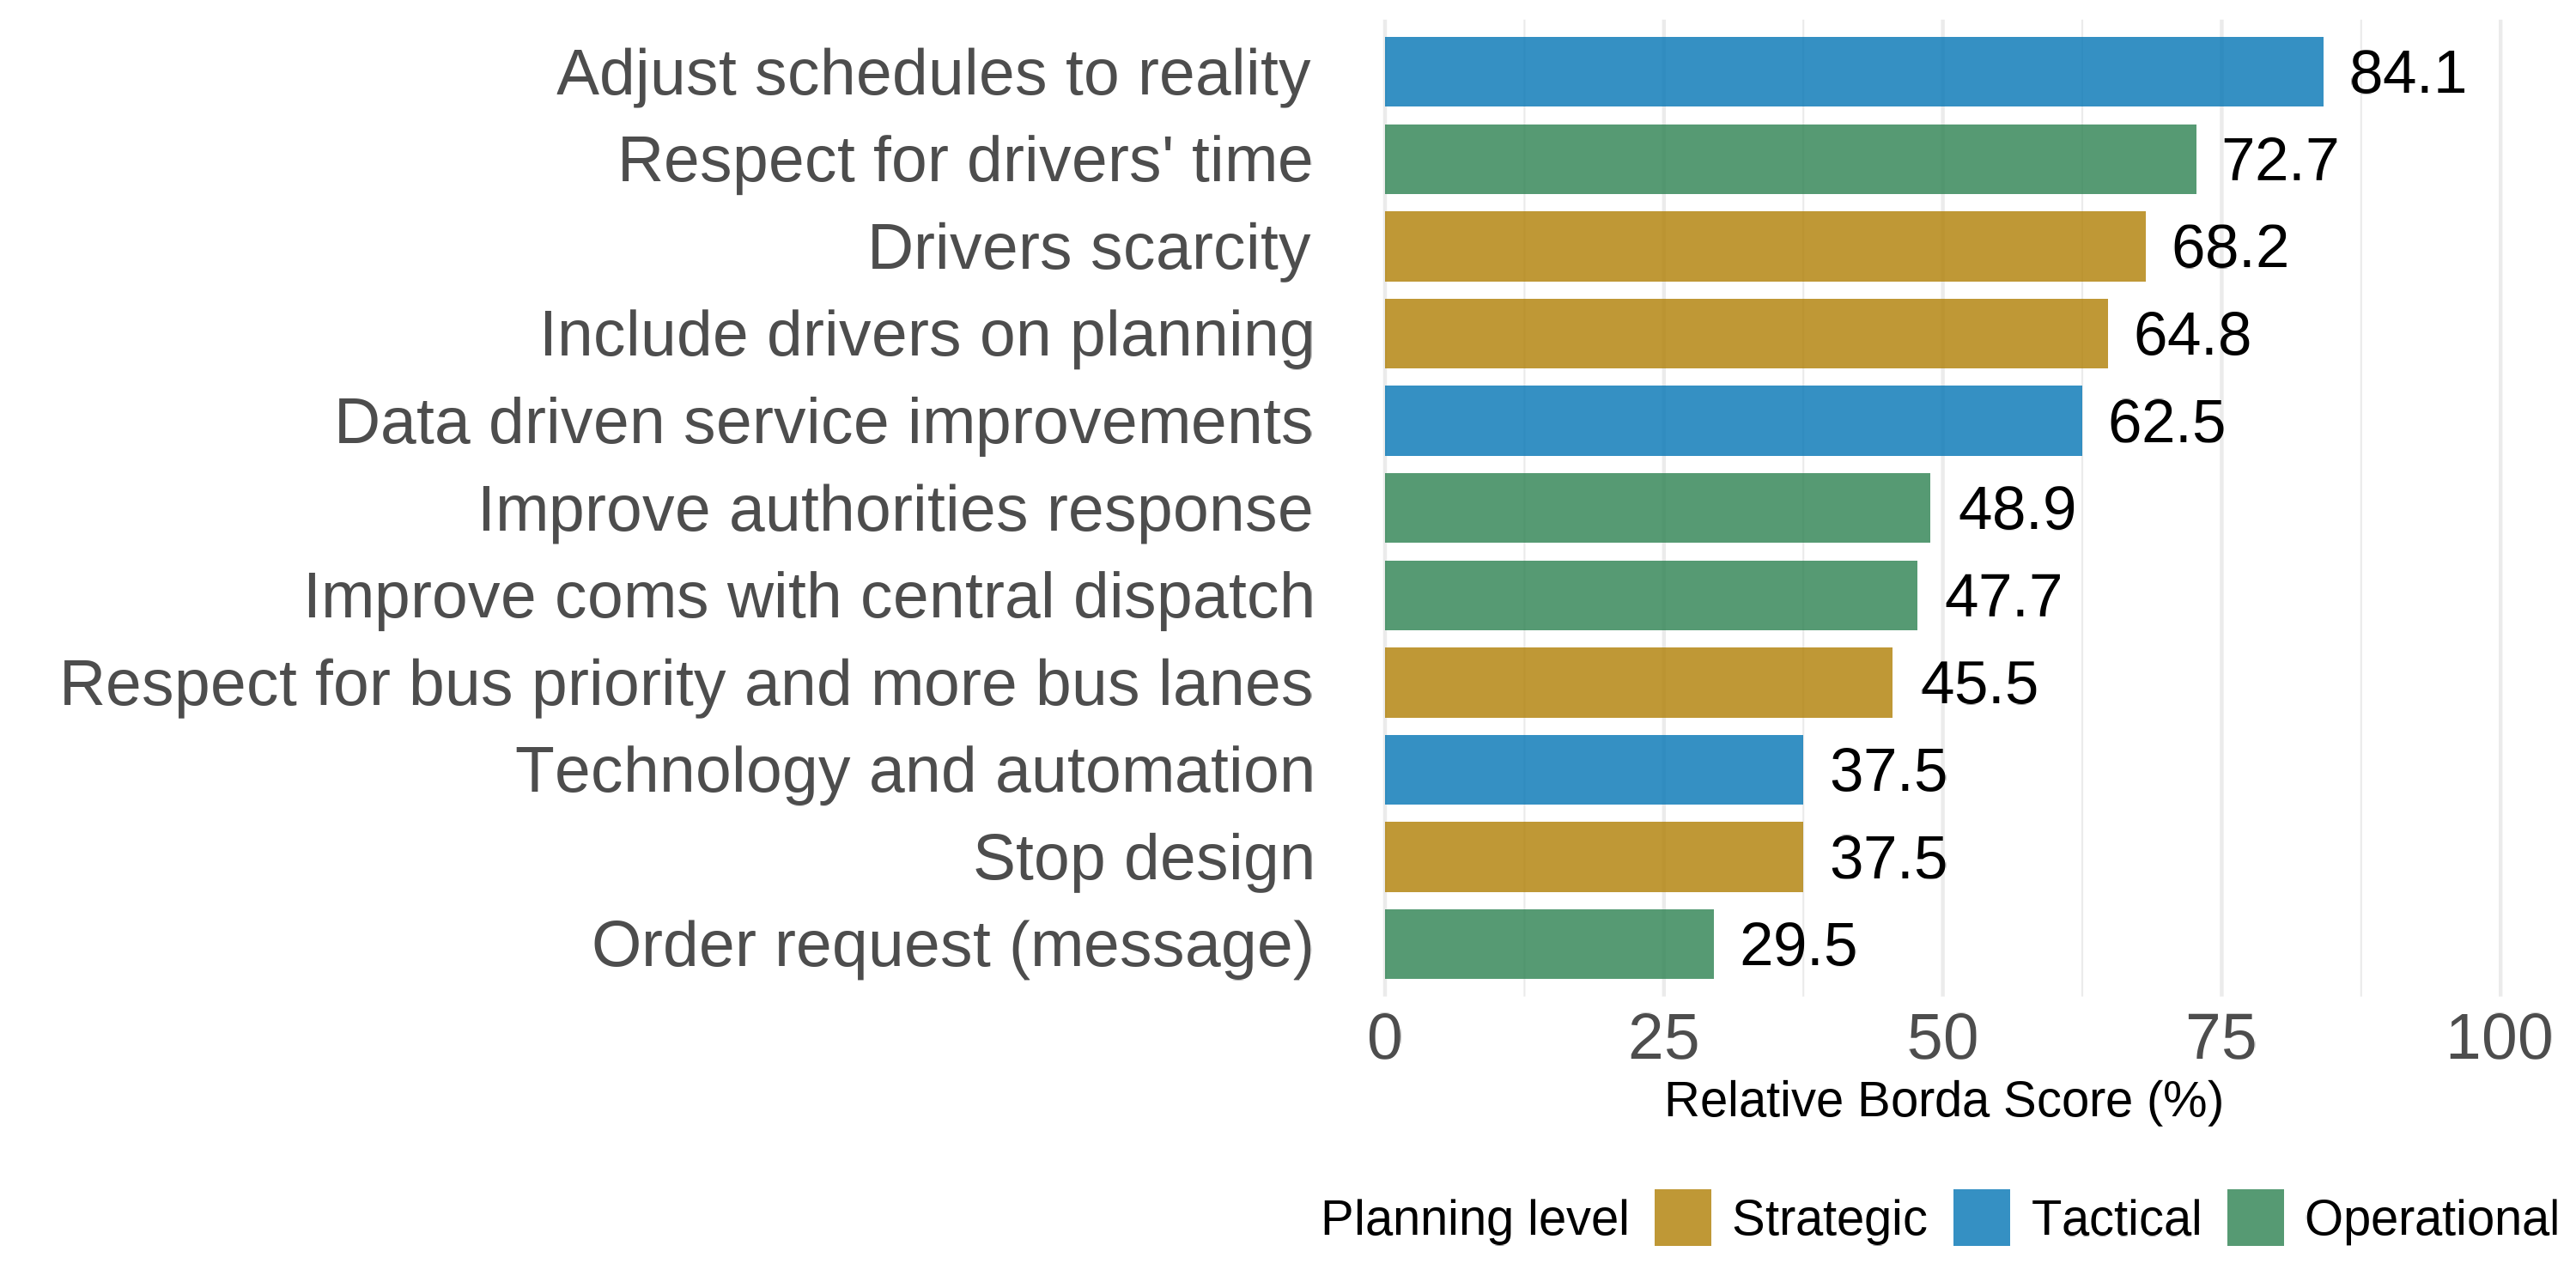
![]() Focus Group Ranking Analysis
Focus Group Ranking Analysis
Ranking of 11 operational factors prioritize Tactical Planning (Borda Score = 61.4) and Strategic (Borda Score = 54) to Operational (Borda Score = 49.7)
Extra
![]() Focus Group Ranking Analysis
Focus Group Ranking Analysis
Ranking of 11 operational factors prioritize Tactical Planning (Borda Score = 61.4) and Strategic (Borda Score = 54) to Operational (Borda Score = 49.7)
Further supports that drivers tacit knowledge goes beyond their functional role and hold valuable system-wide perspectives
![]()
Extra
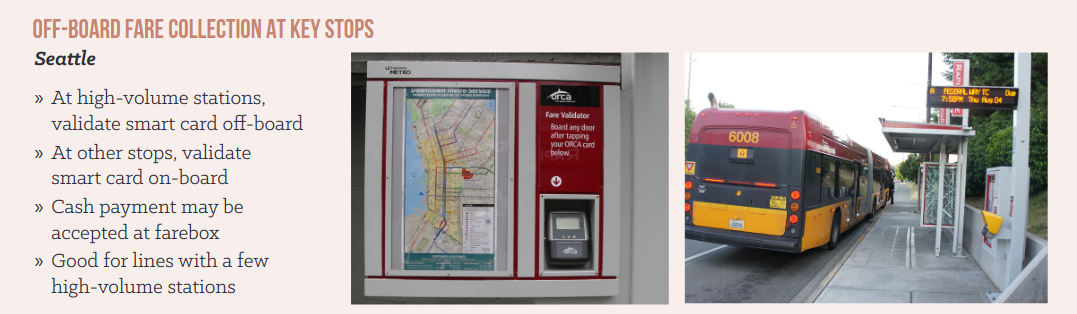
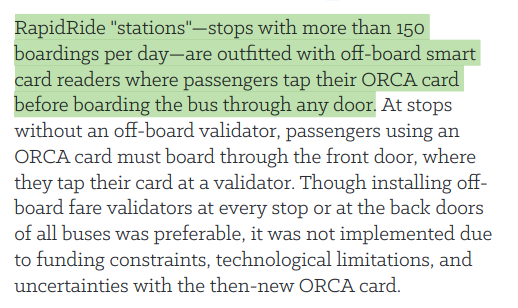
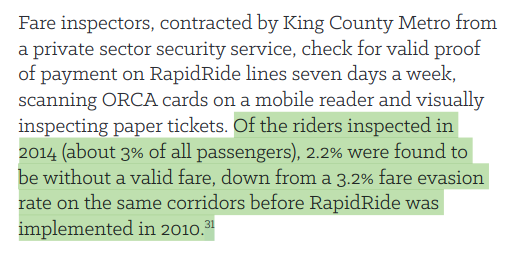
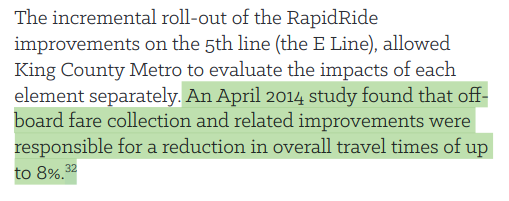
Better Boarding, Better Buses (NACTO 2017)
Extra
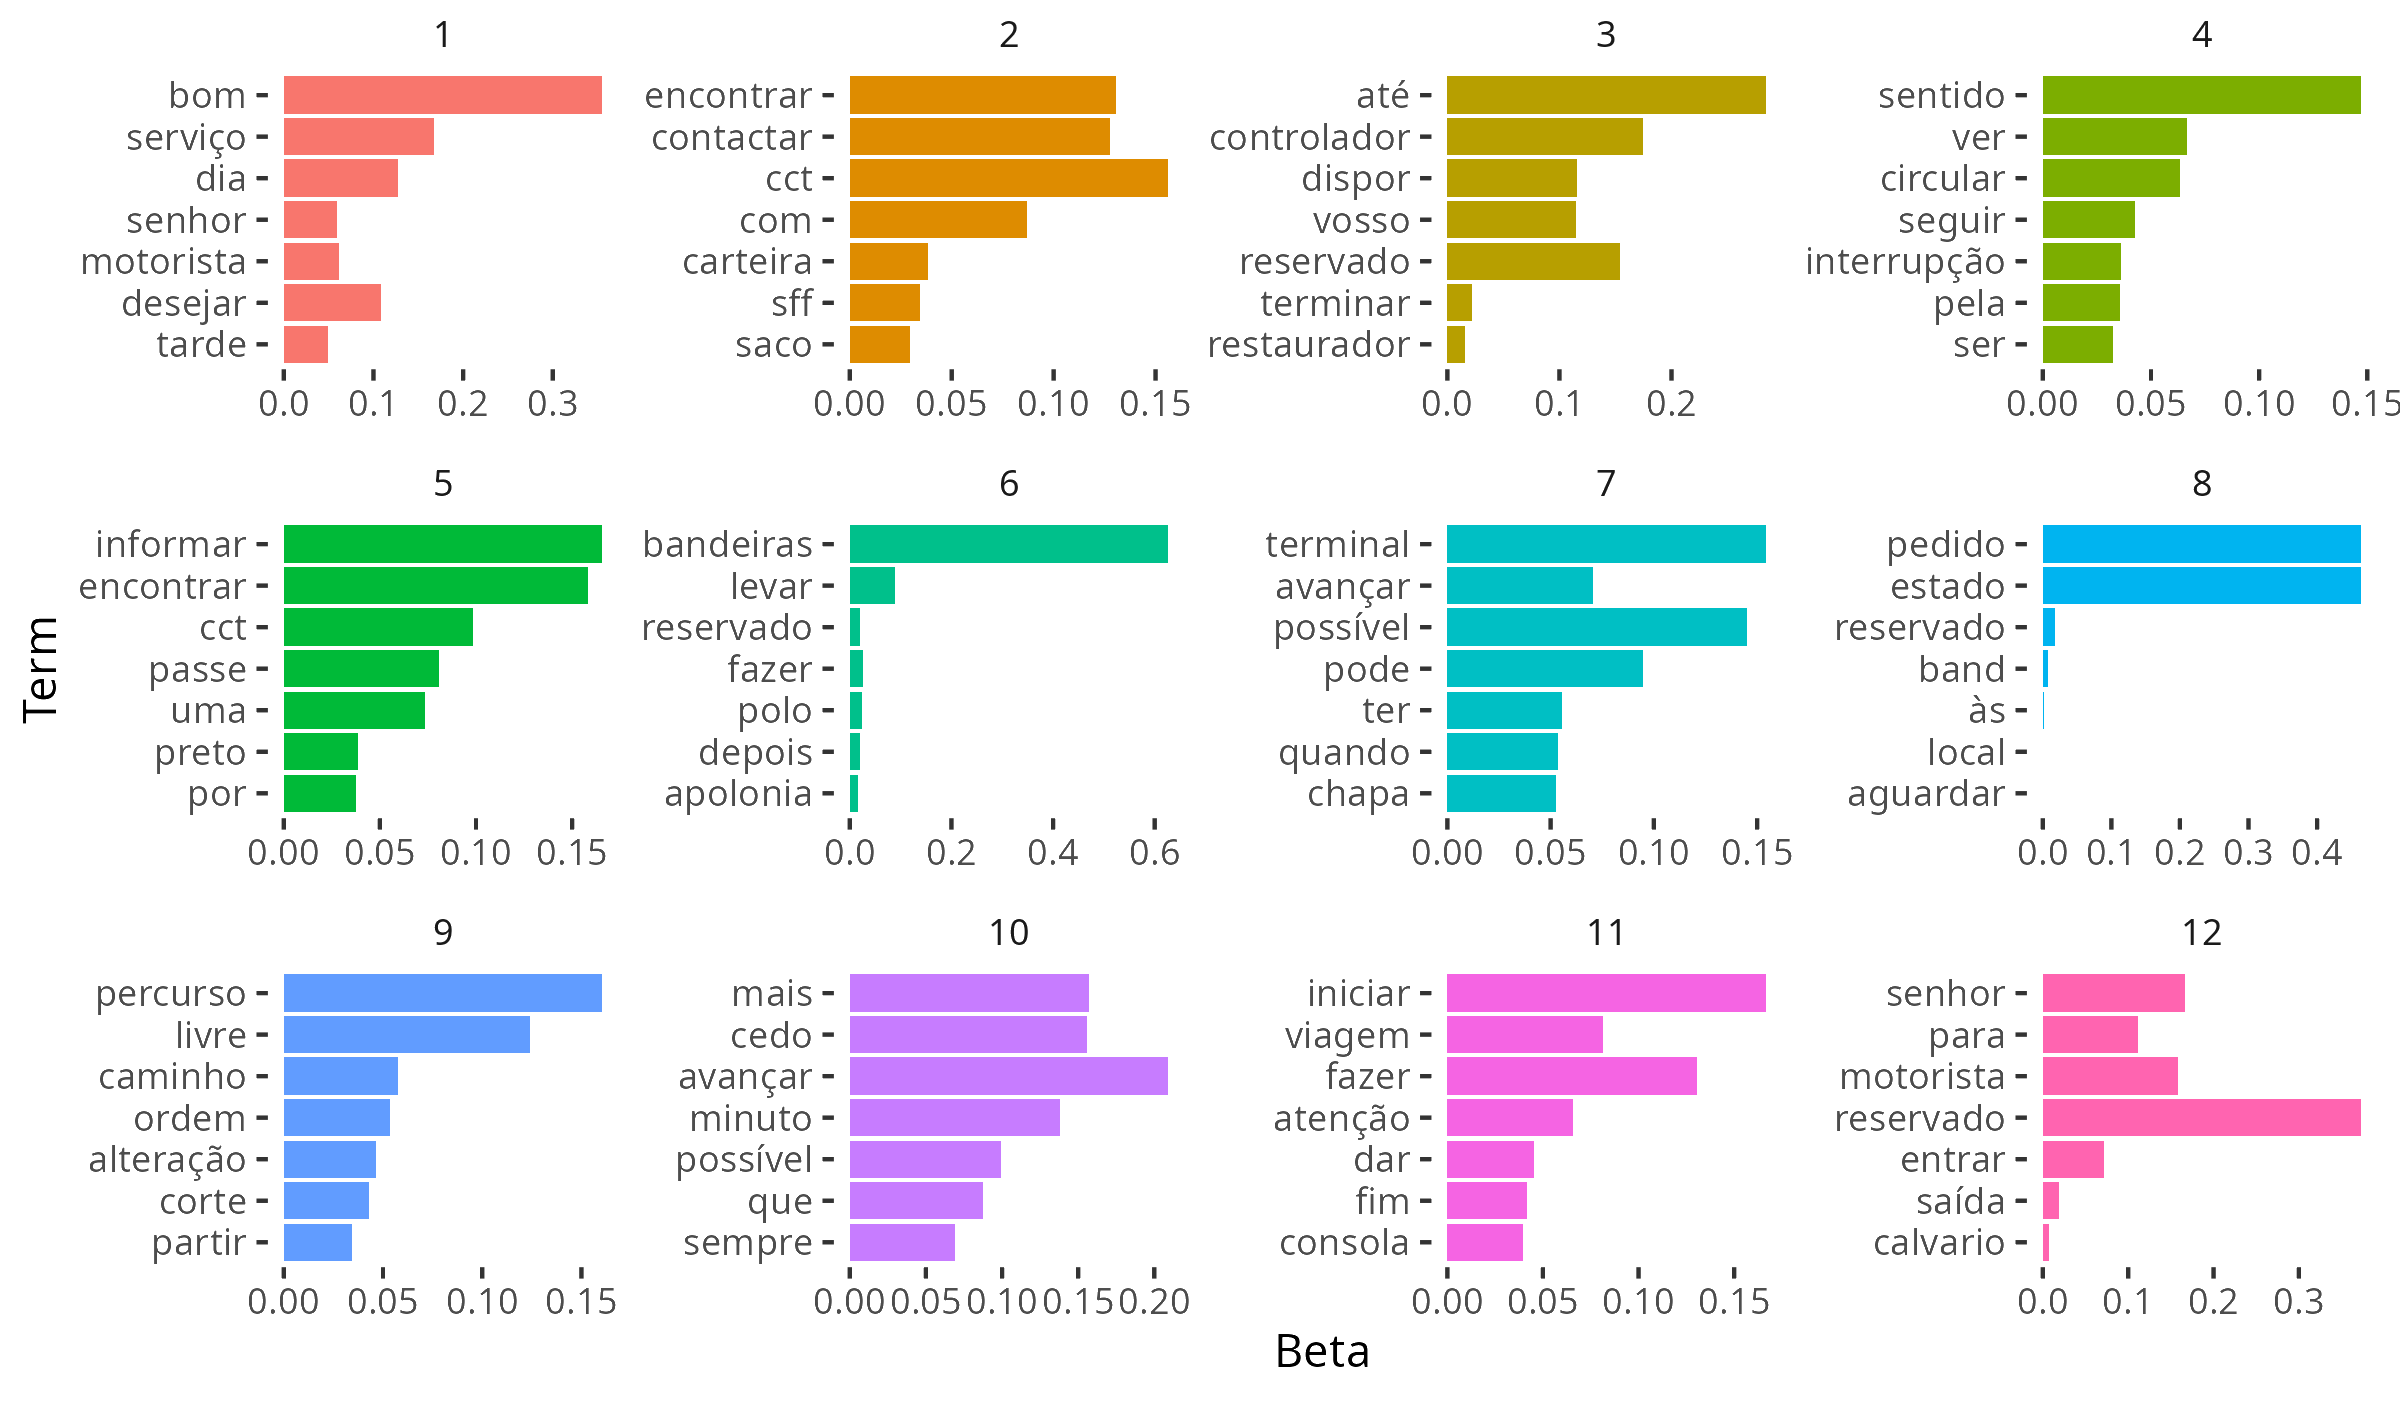
![]() Free Text Messages Categorization
Free Text Messages Categorization
LDA produced 12 topics that were manually reviewed and interpreted
Extra
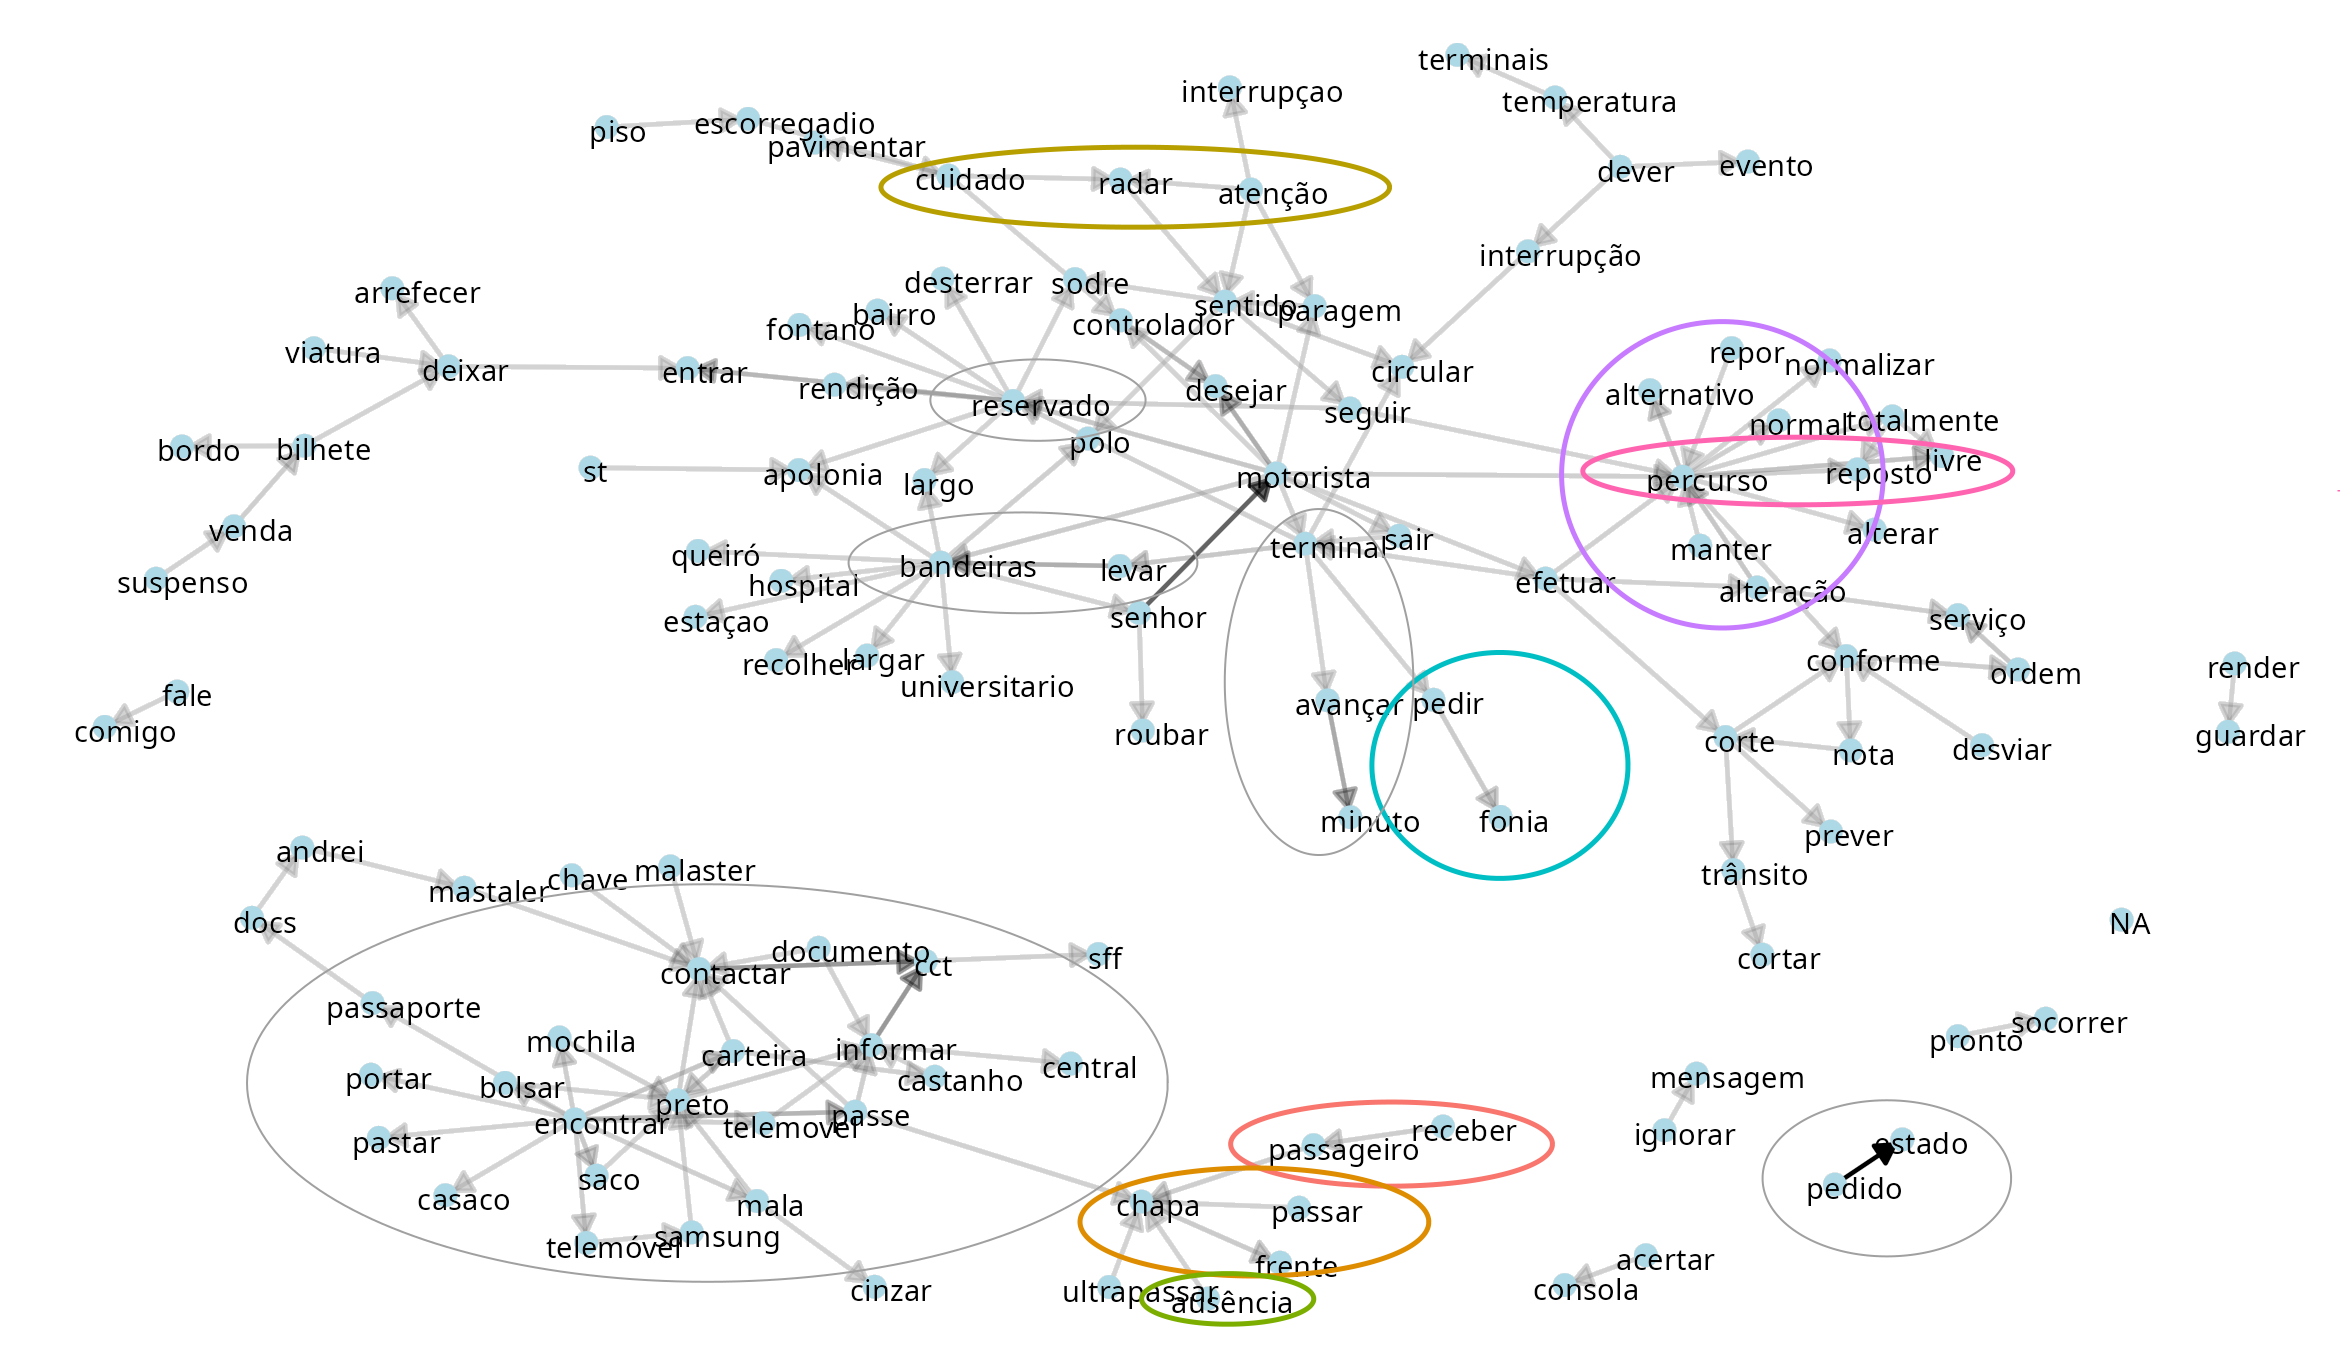
![]() Free Text Messages Categorization
Free Text Messages Categorization
Complemented by bigrams that reinforced and extended previous findings
Extra
![]() Messages Spatial Dynamics
Messages Spatial Dynamics
Wheelchair passengers 🦽
Extra
![]() Messages Spatial Dynamics
Messages Spatial Dynamics
Blocked road 🚫
Extra
![]() Messages Spatial Dynamics
Messages Spatial Dynamics
Full bus 👥
Extra
![]() Messages Spatial Dynamics
Messages Spatial Dynamics
Ticket fraud 🚨
Extra
![]() Messages Spatial Dynamics
Messages Spatial Dynamics
Bus bunching 🚌🚌
Extra
![]() Events Spatial Dynamics
Events Spatial Dynamics
Bus bunching 🚌🚌
Extra
Reliability Buffer Index
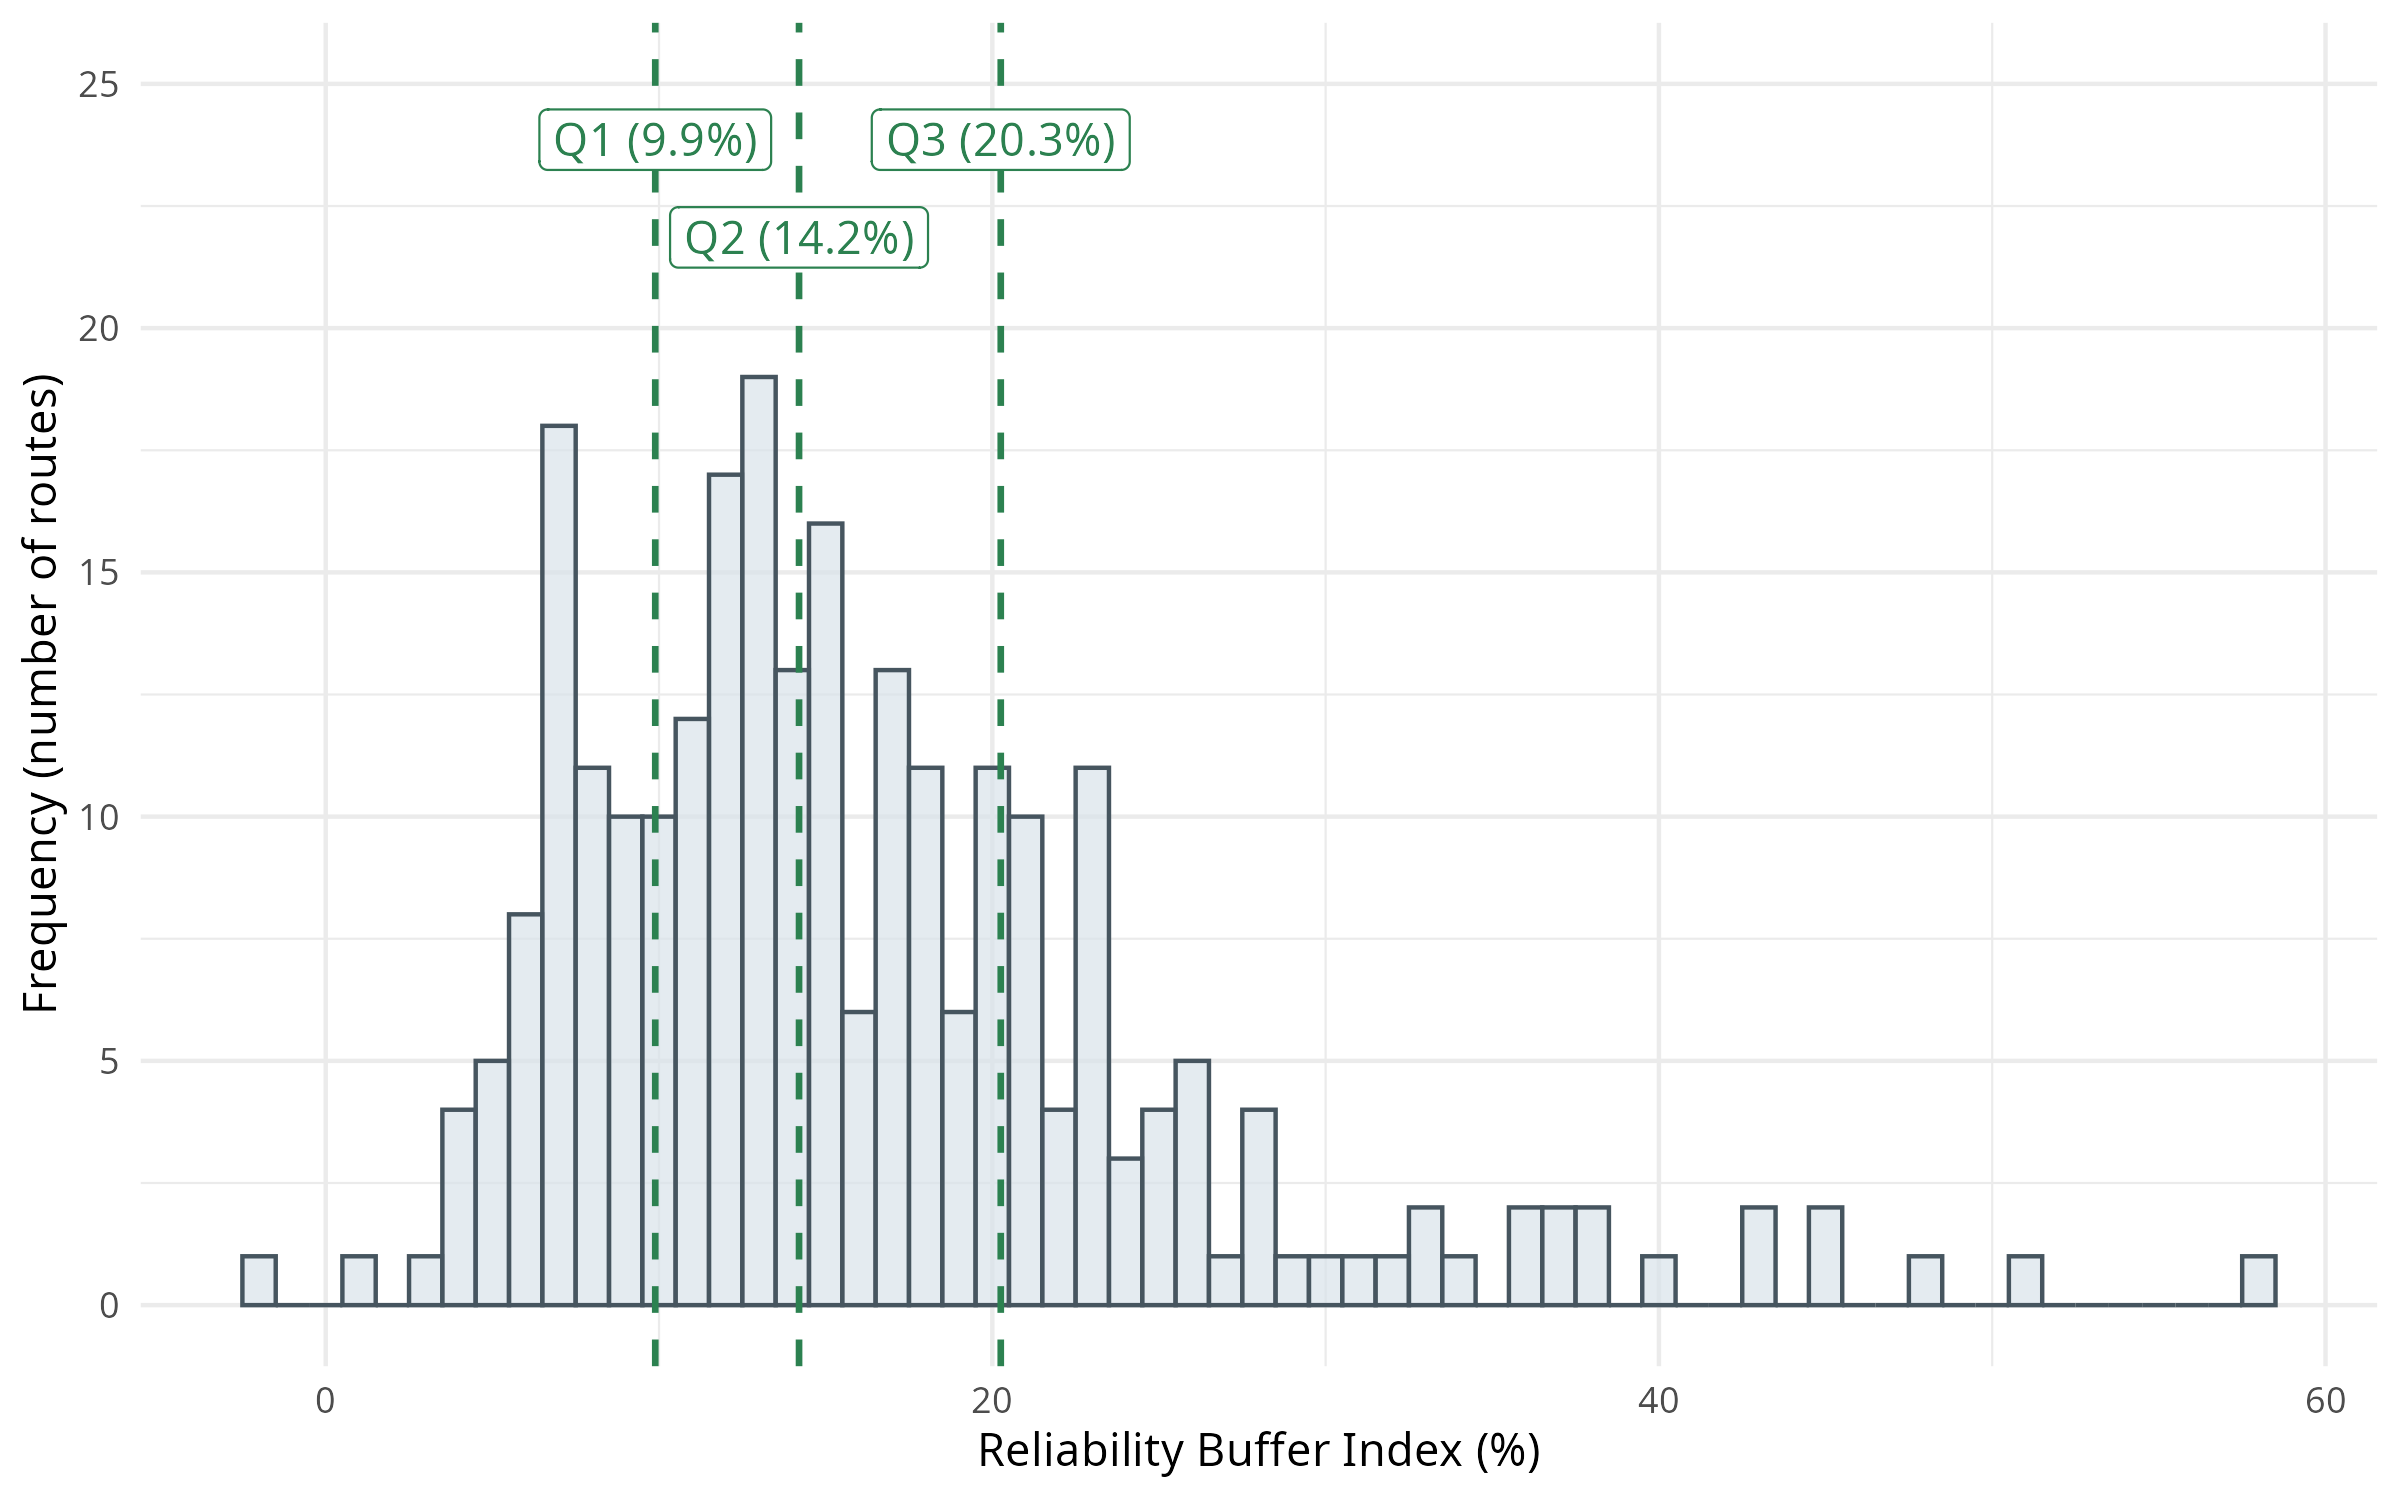
RBI histogram
Extra
Reliability Buffer Index
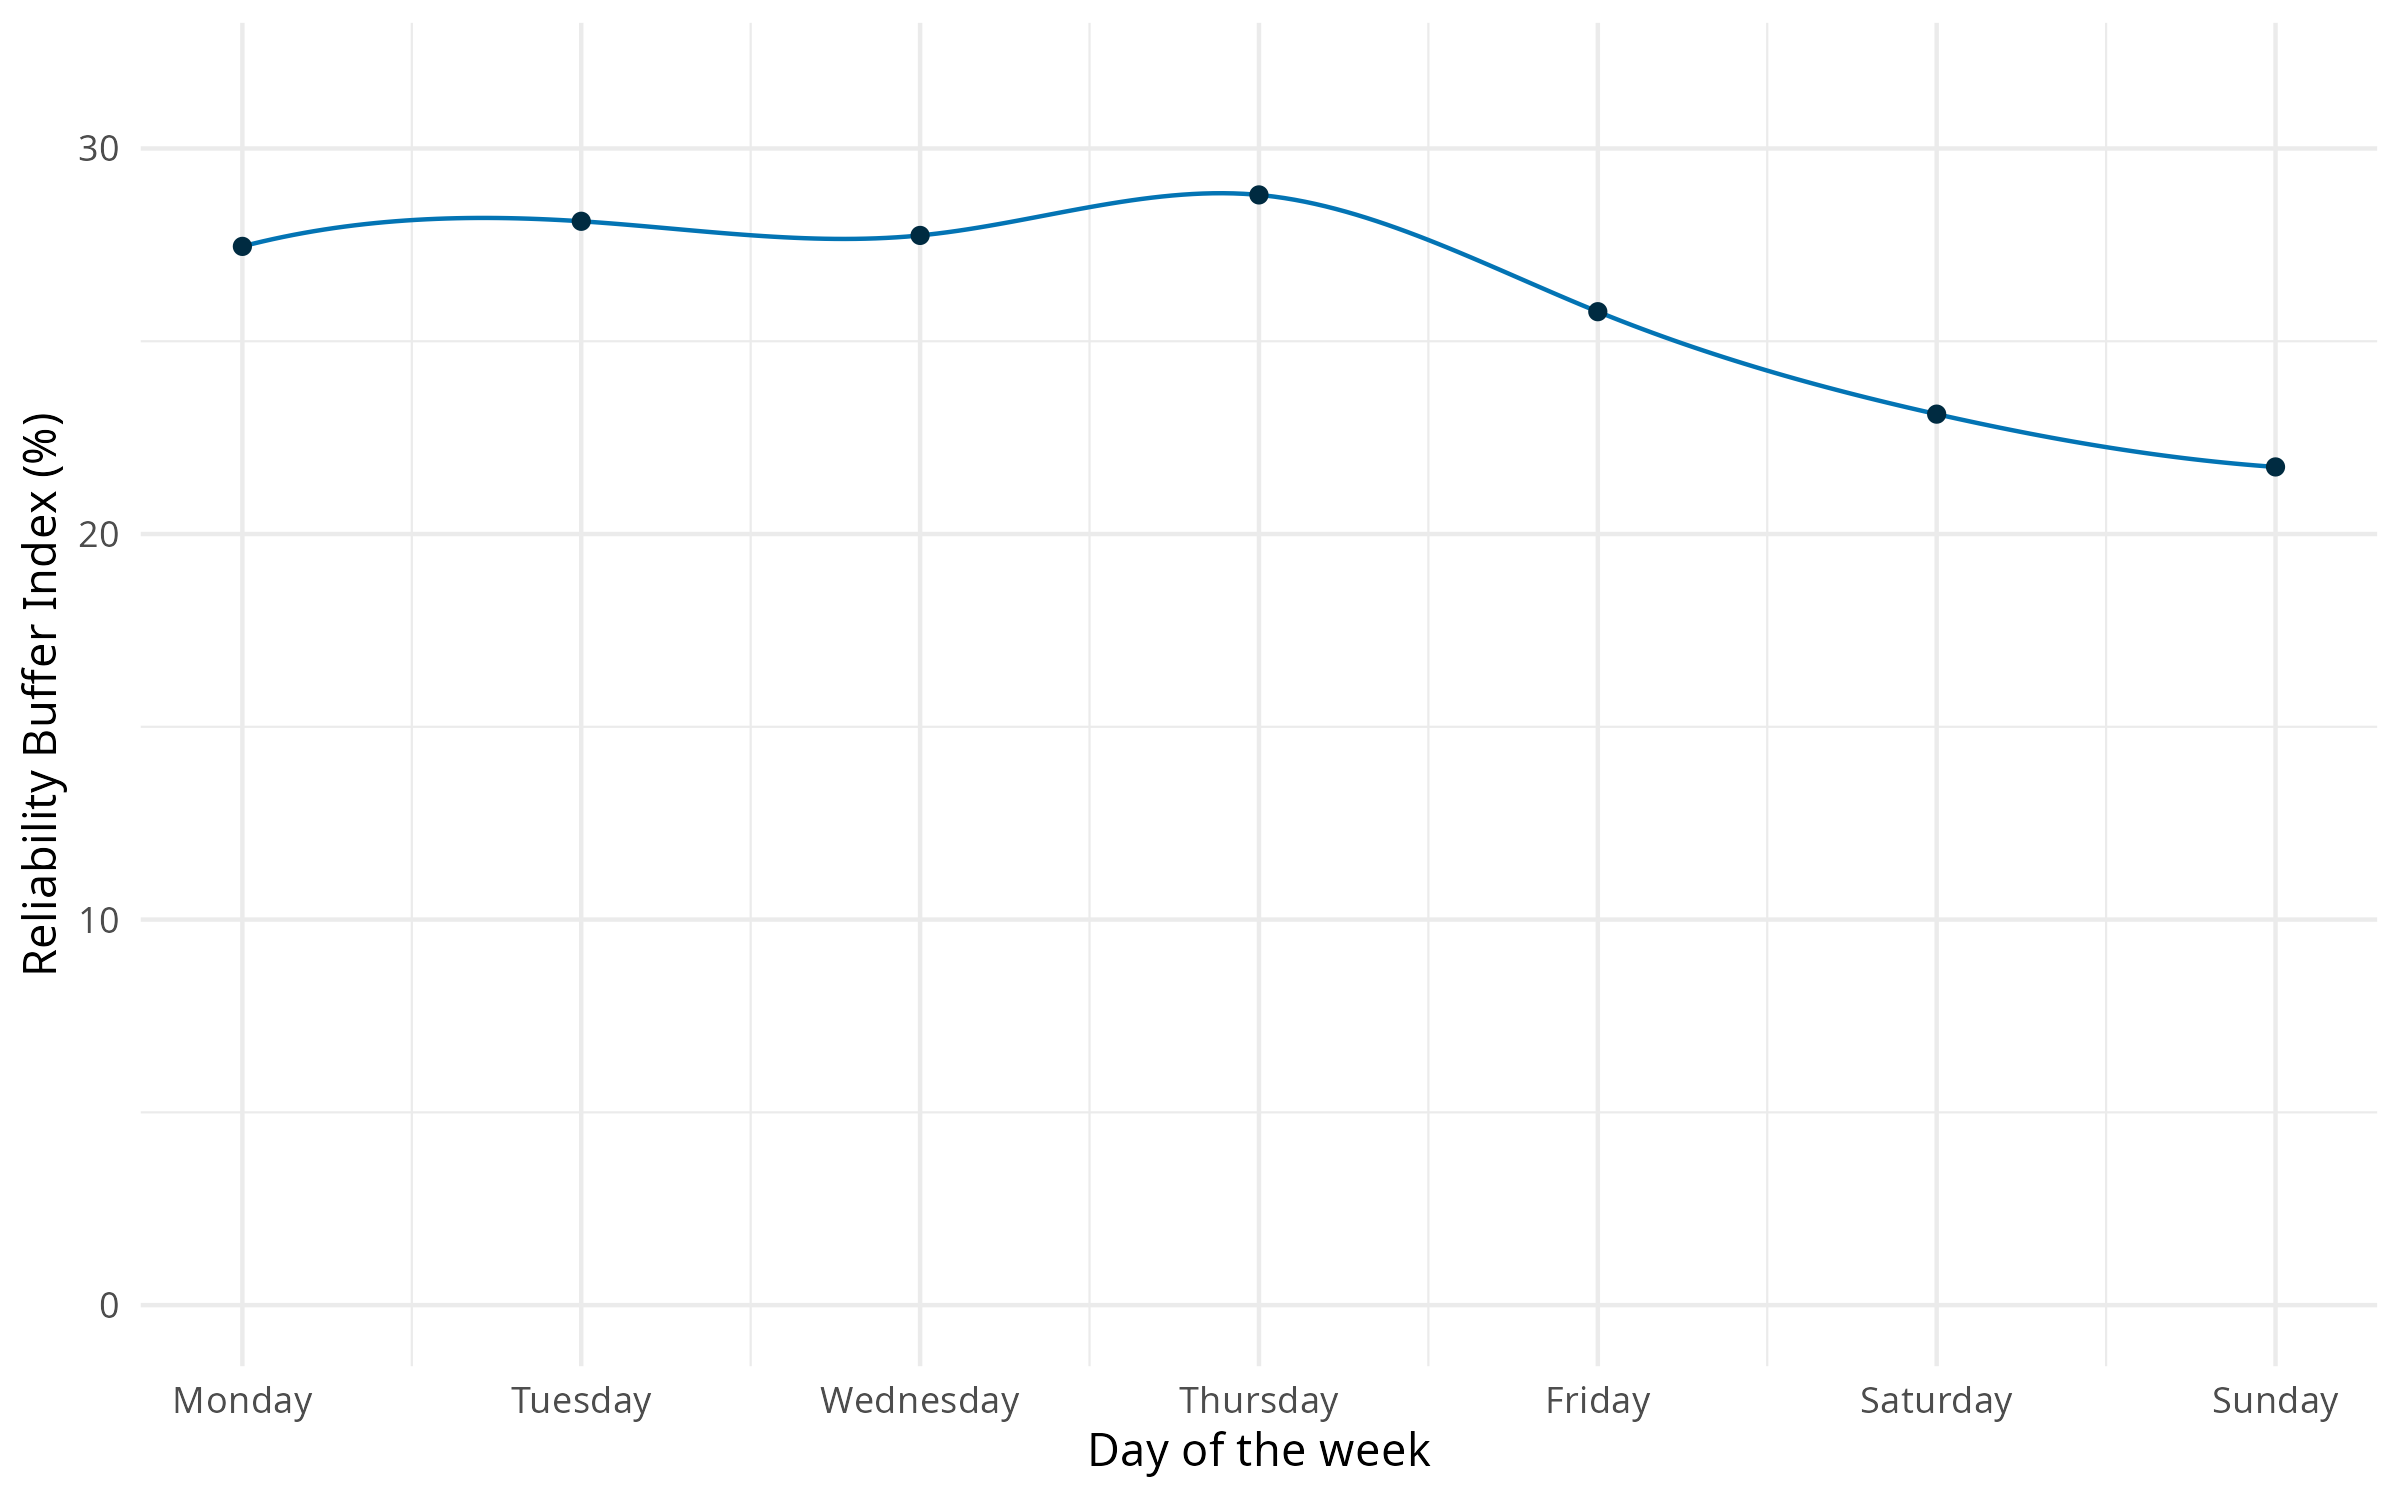
RBI variation through the week
Extra
Reliability Buffer Index
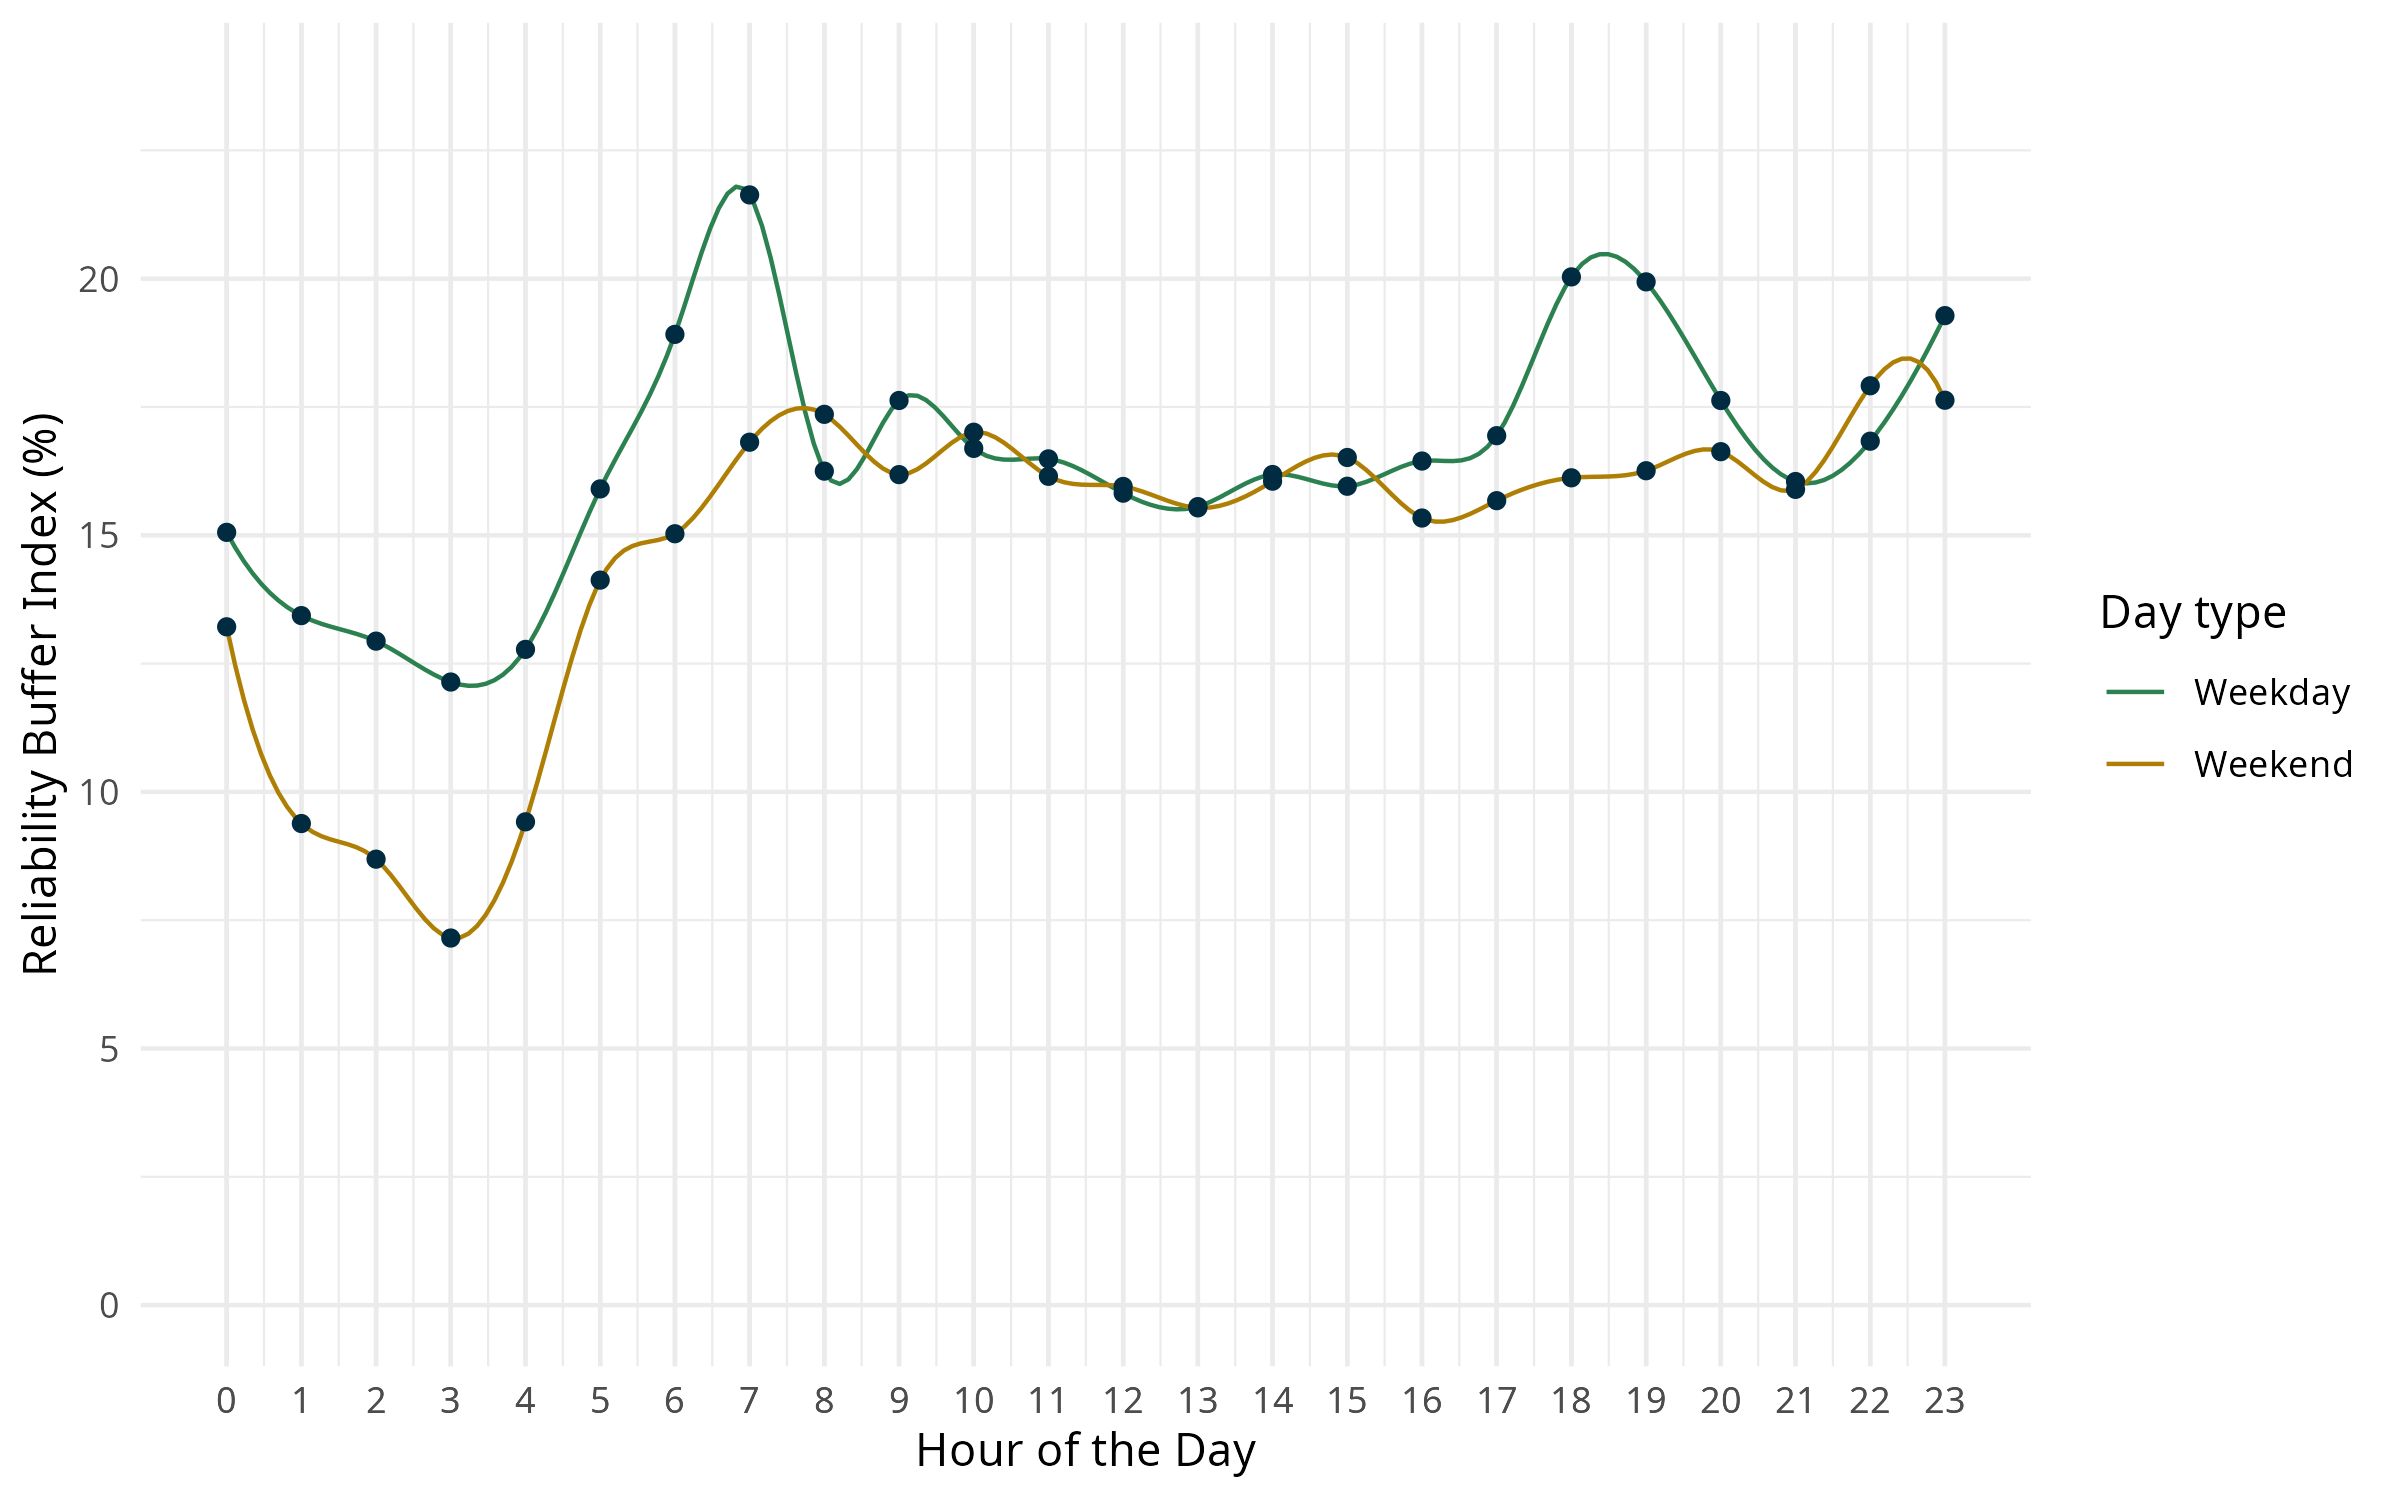
RBI variation through the day
Extra
Bus Bunching
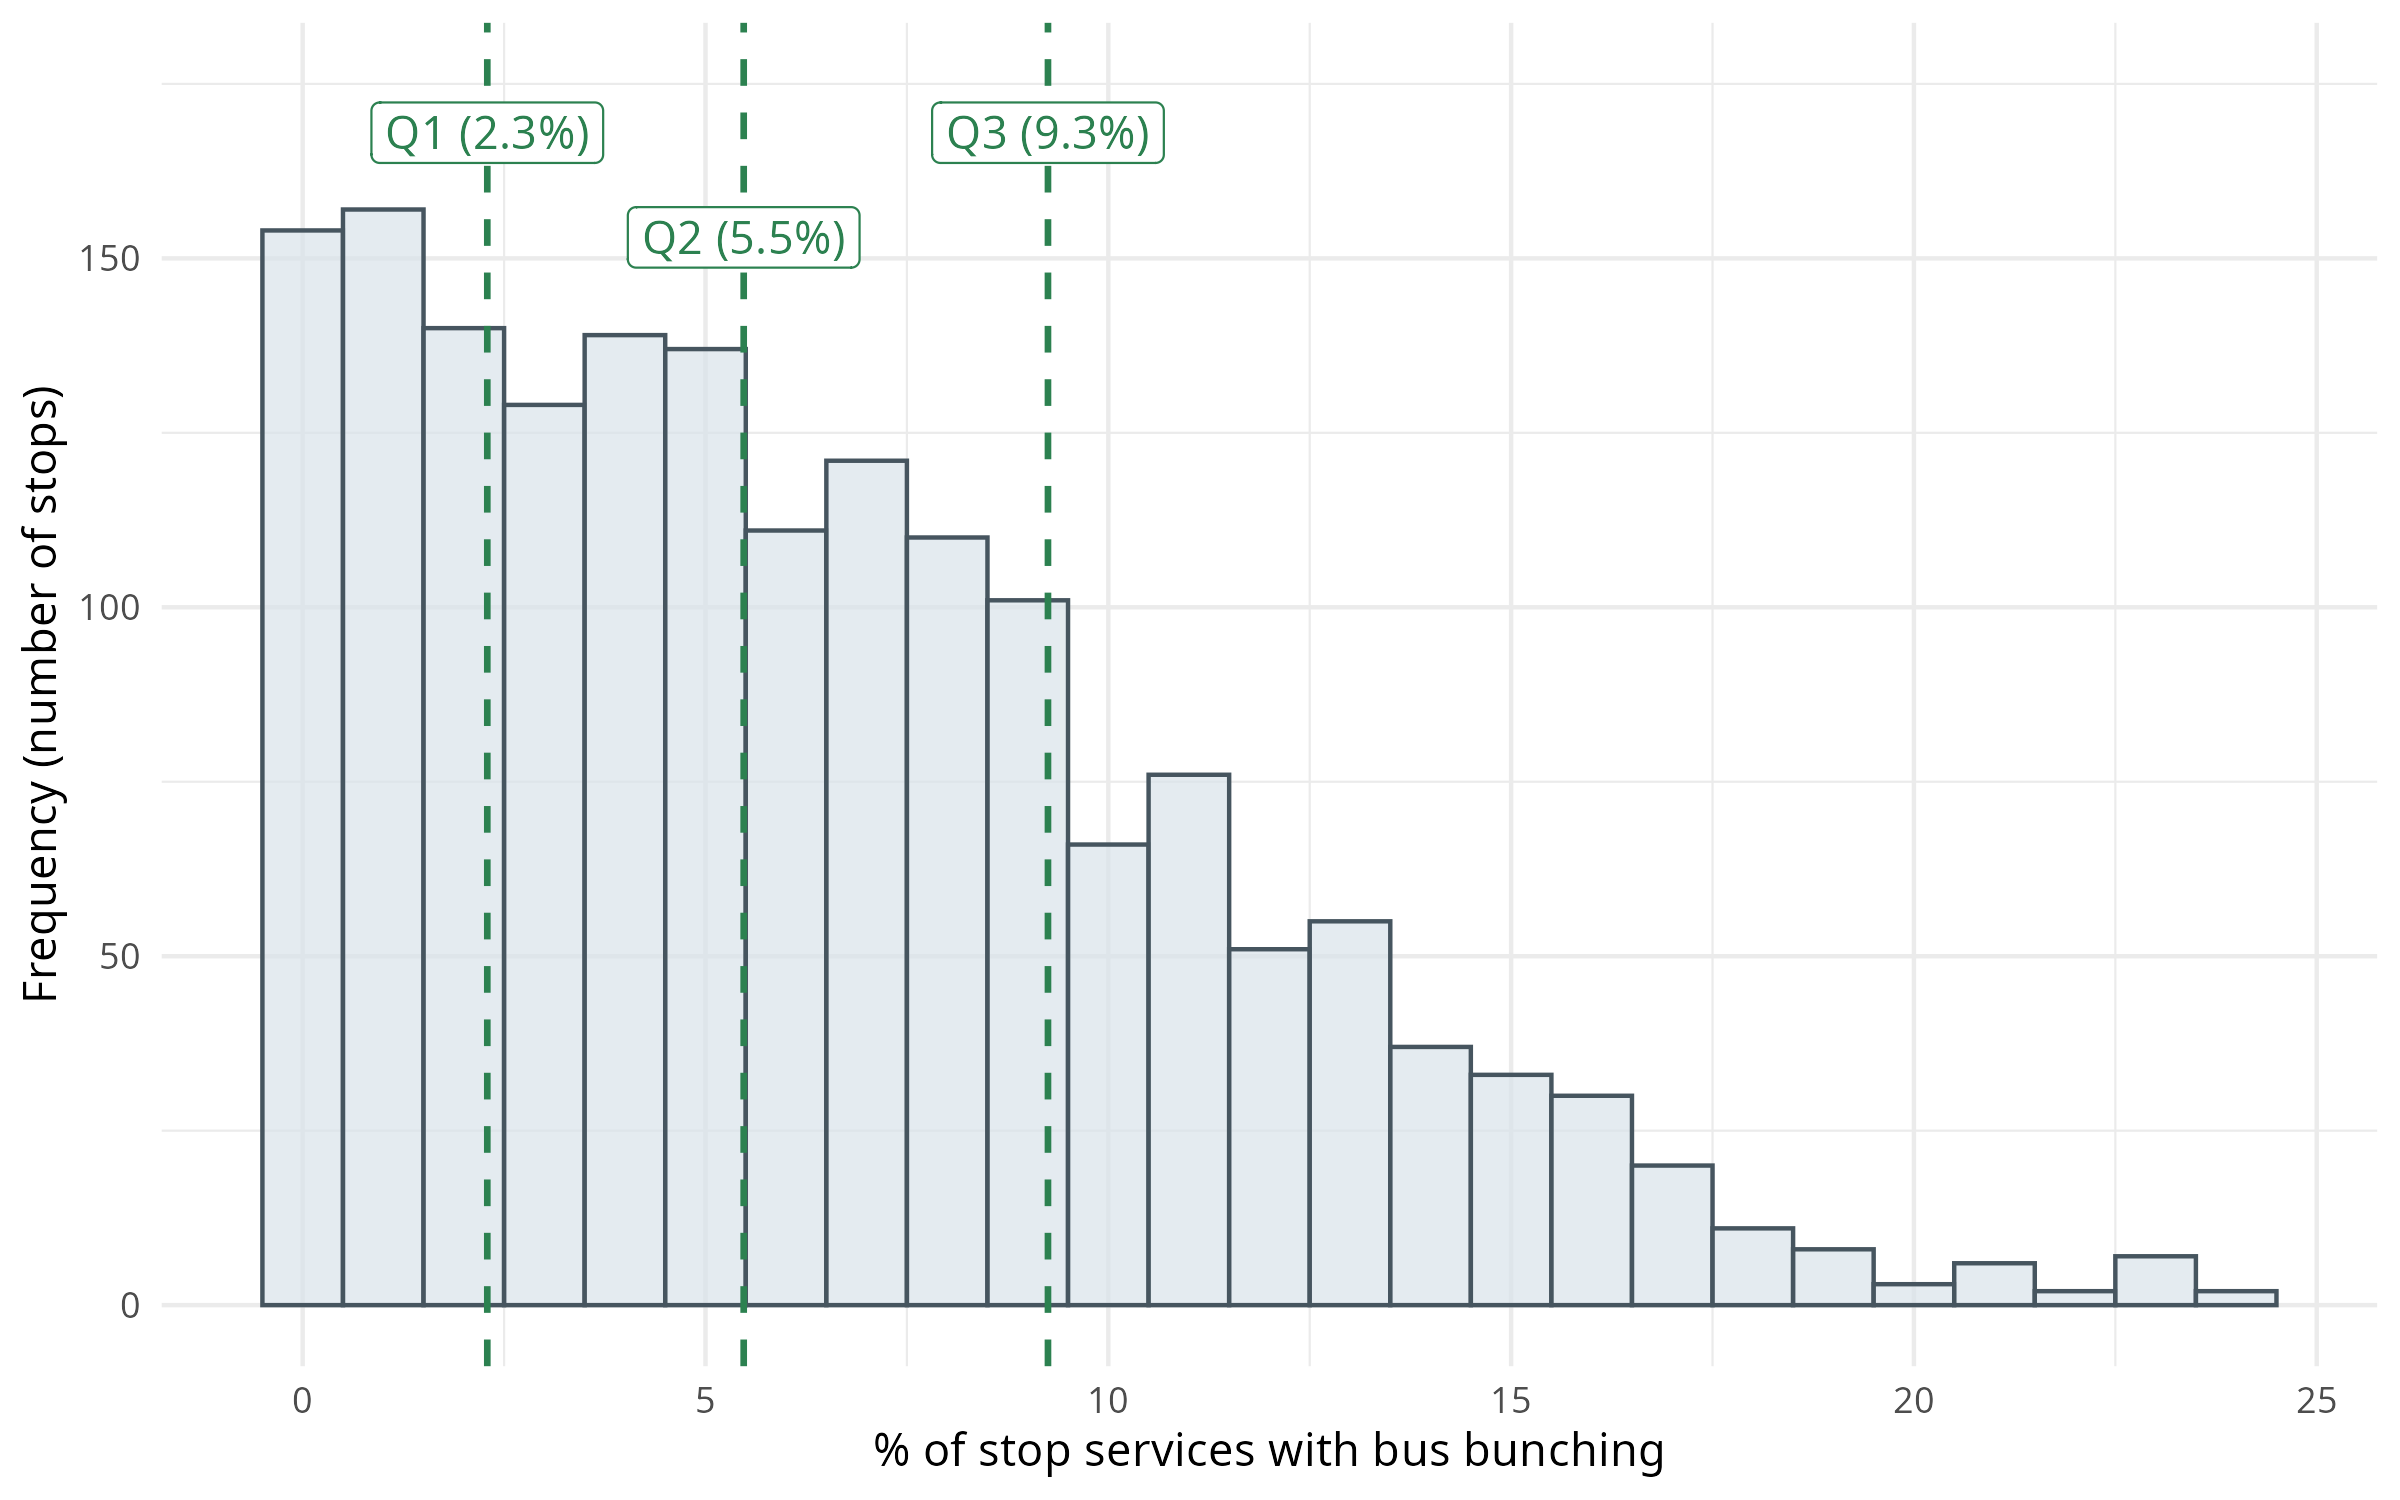
Bus bunching histogram
Extra
Bus Bunching
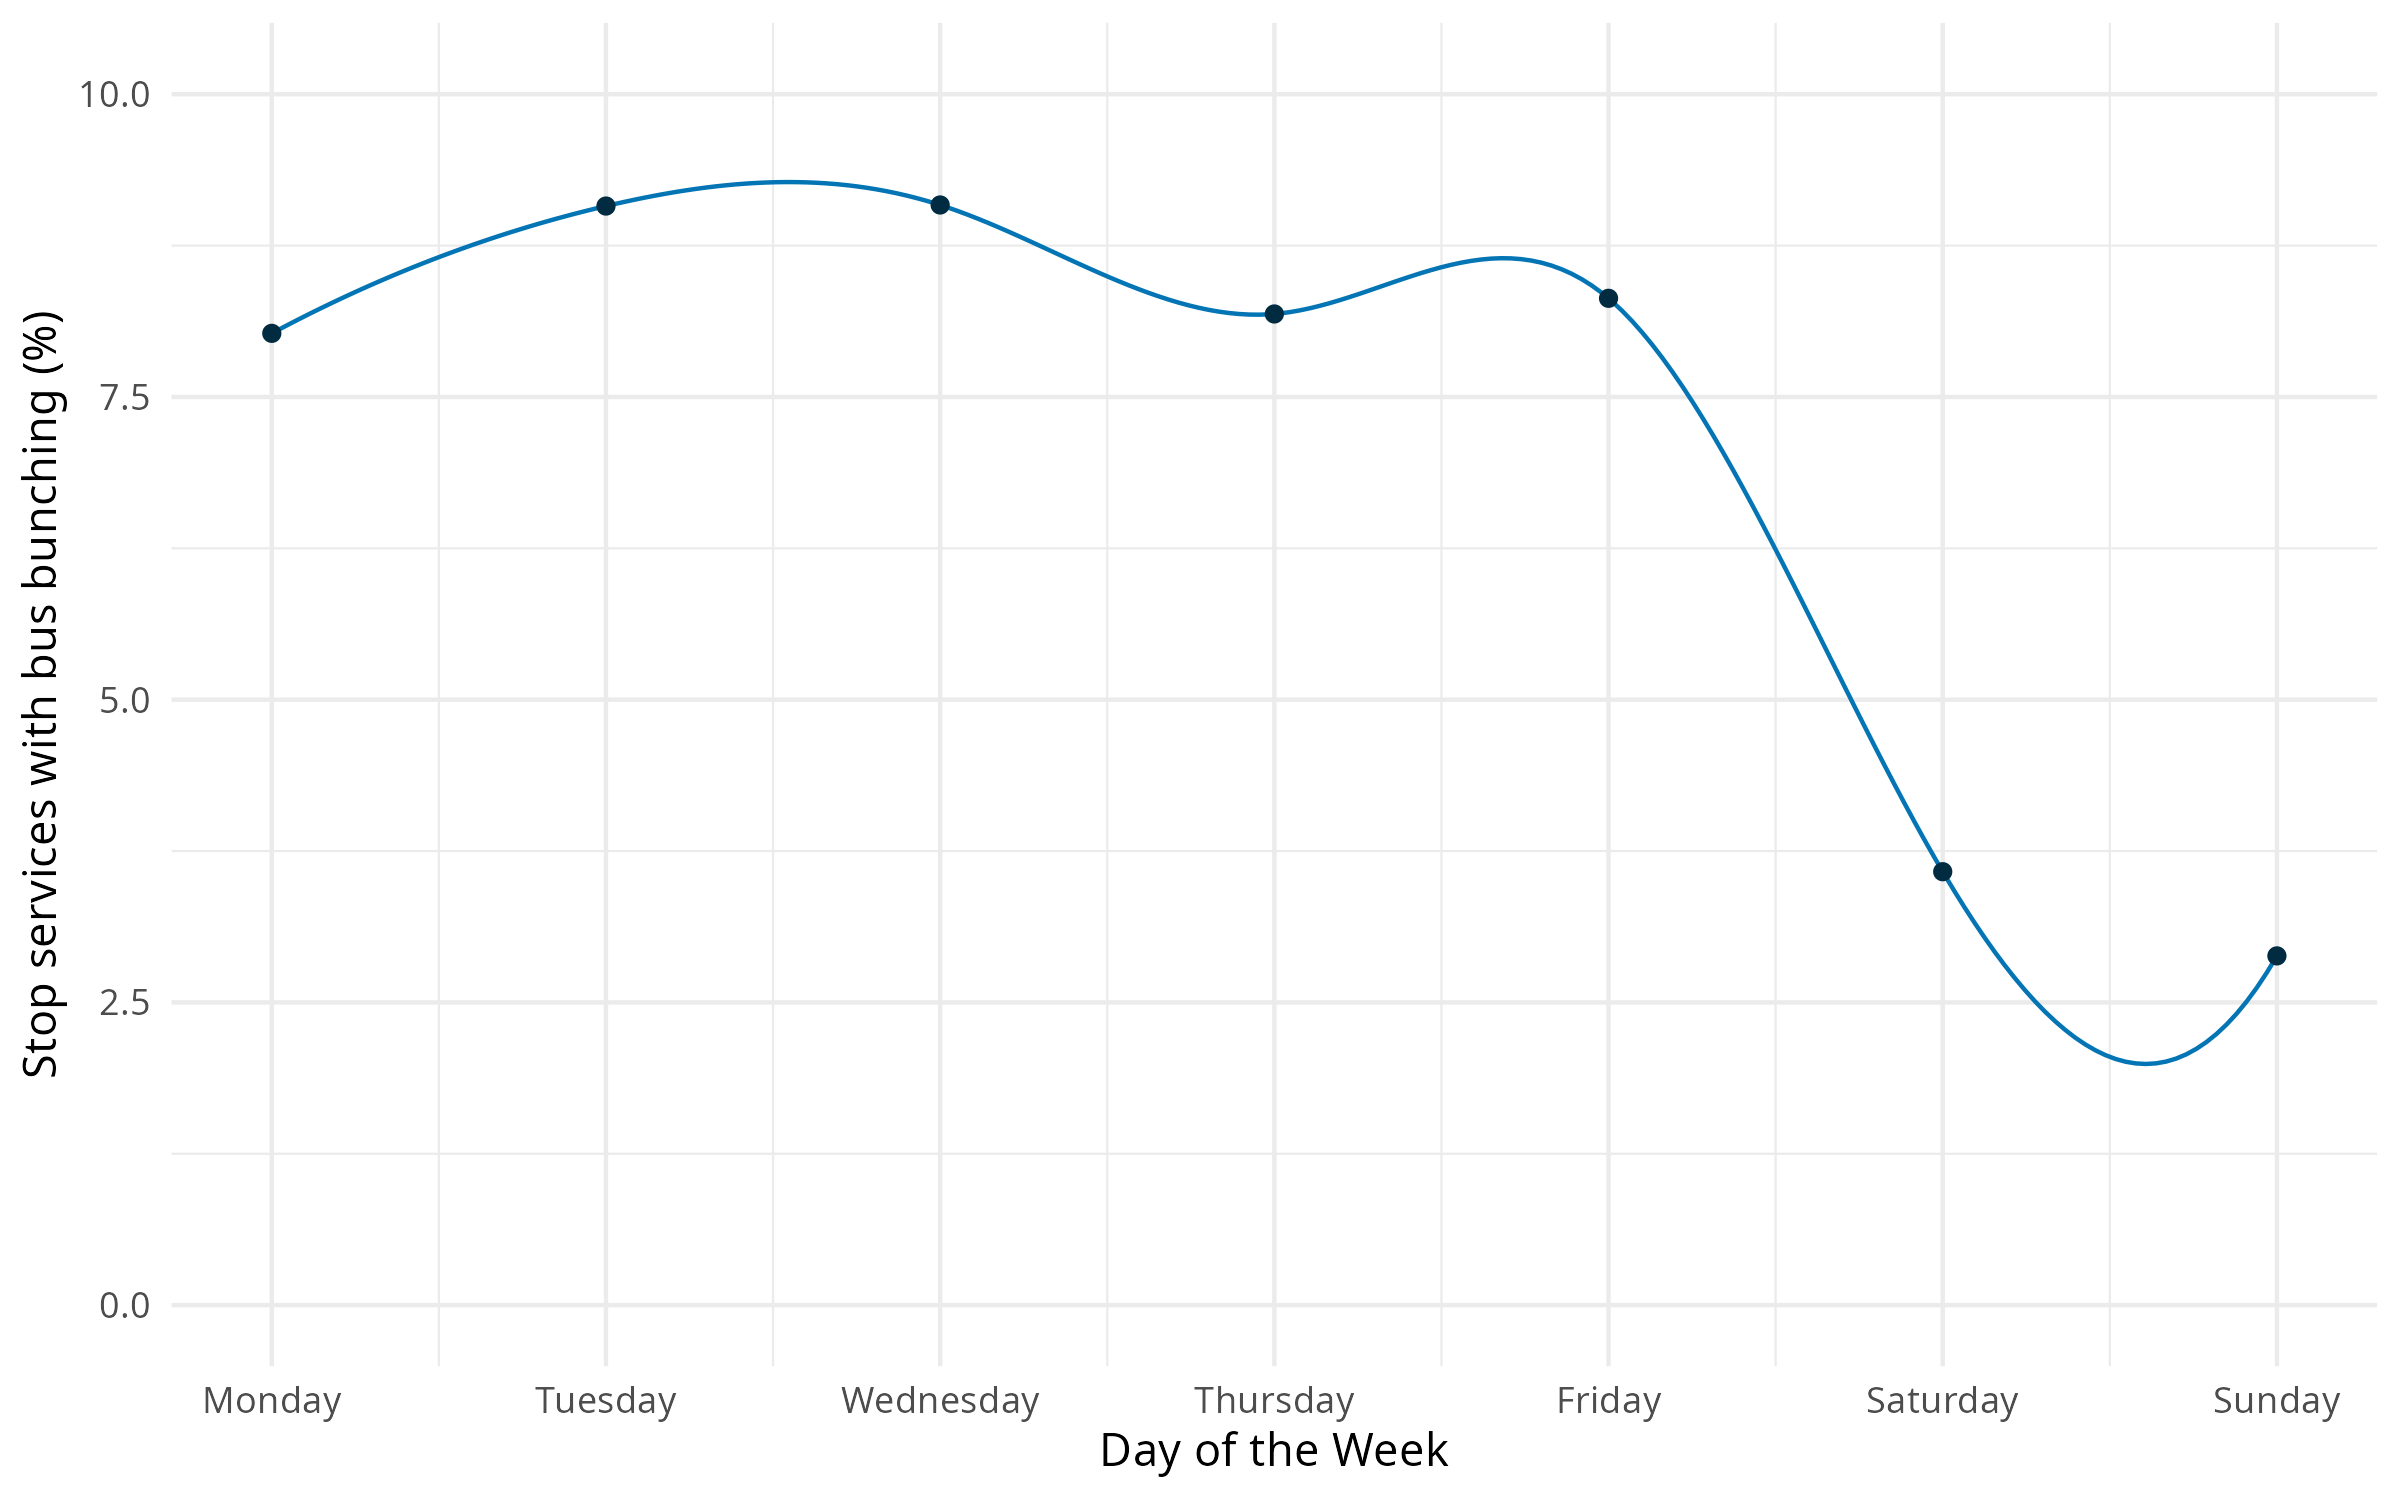
Bus bunching variation through the week
Extra
Bus Bunching
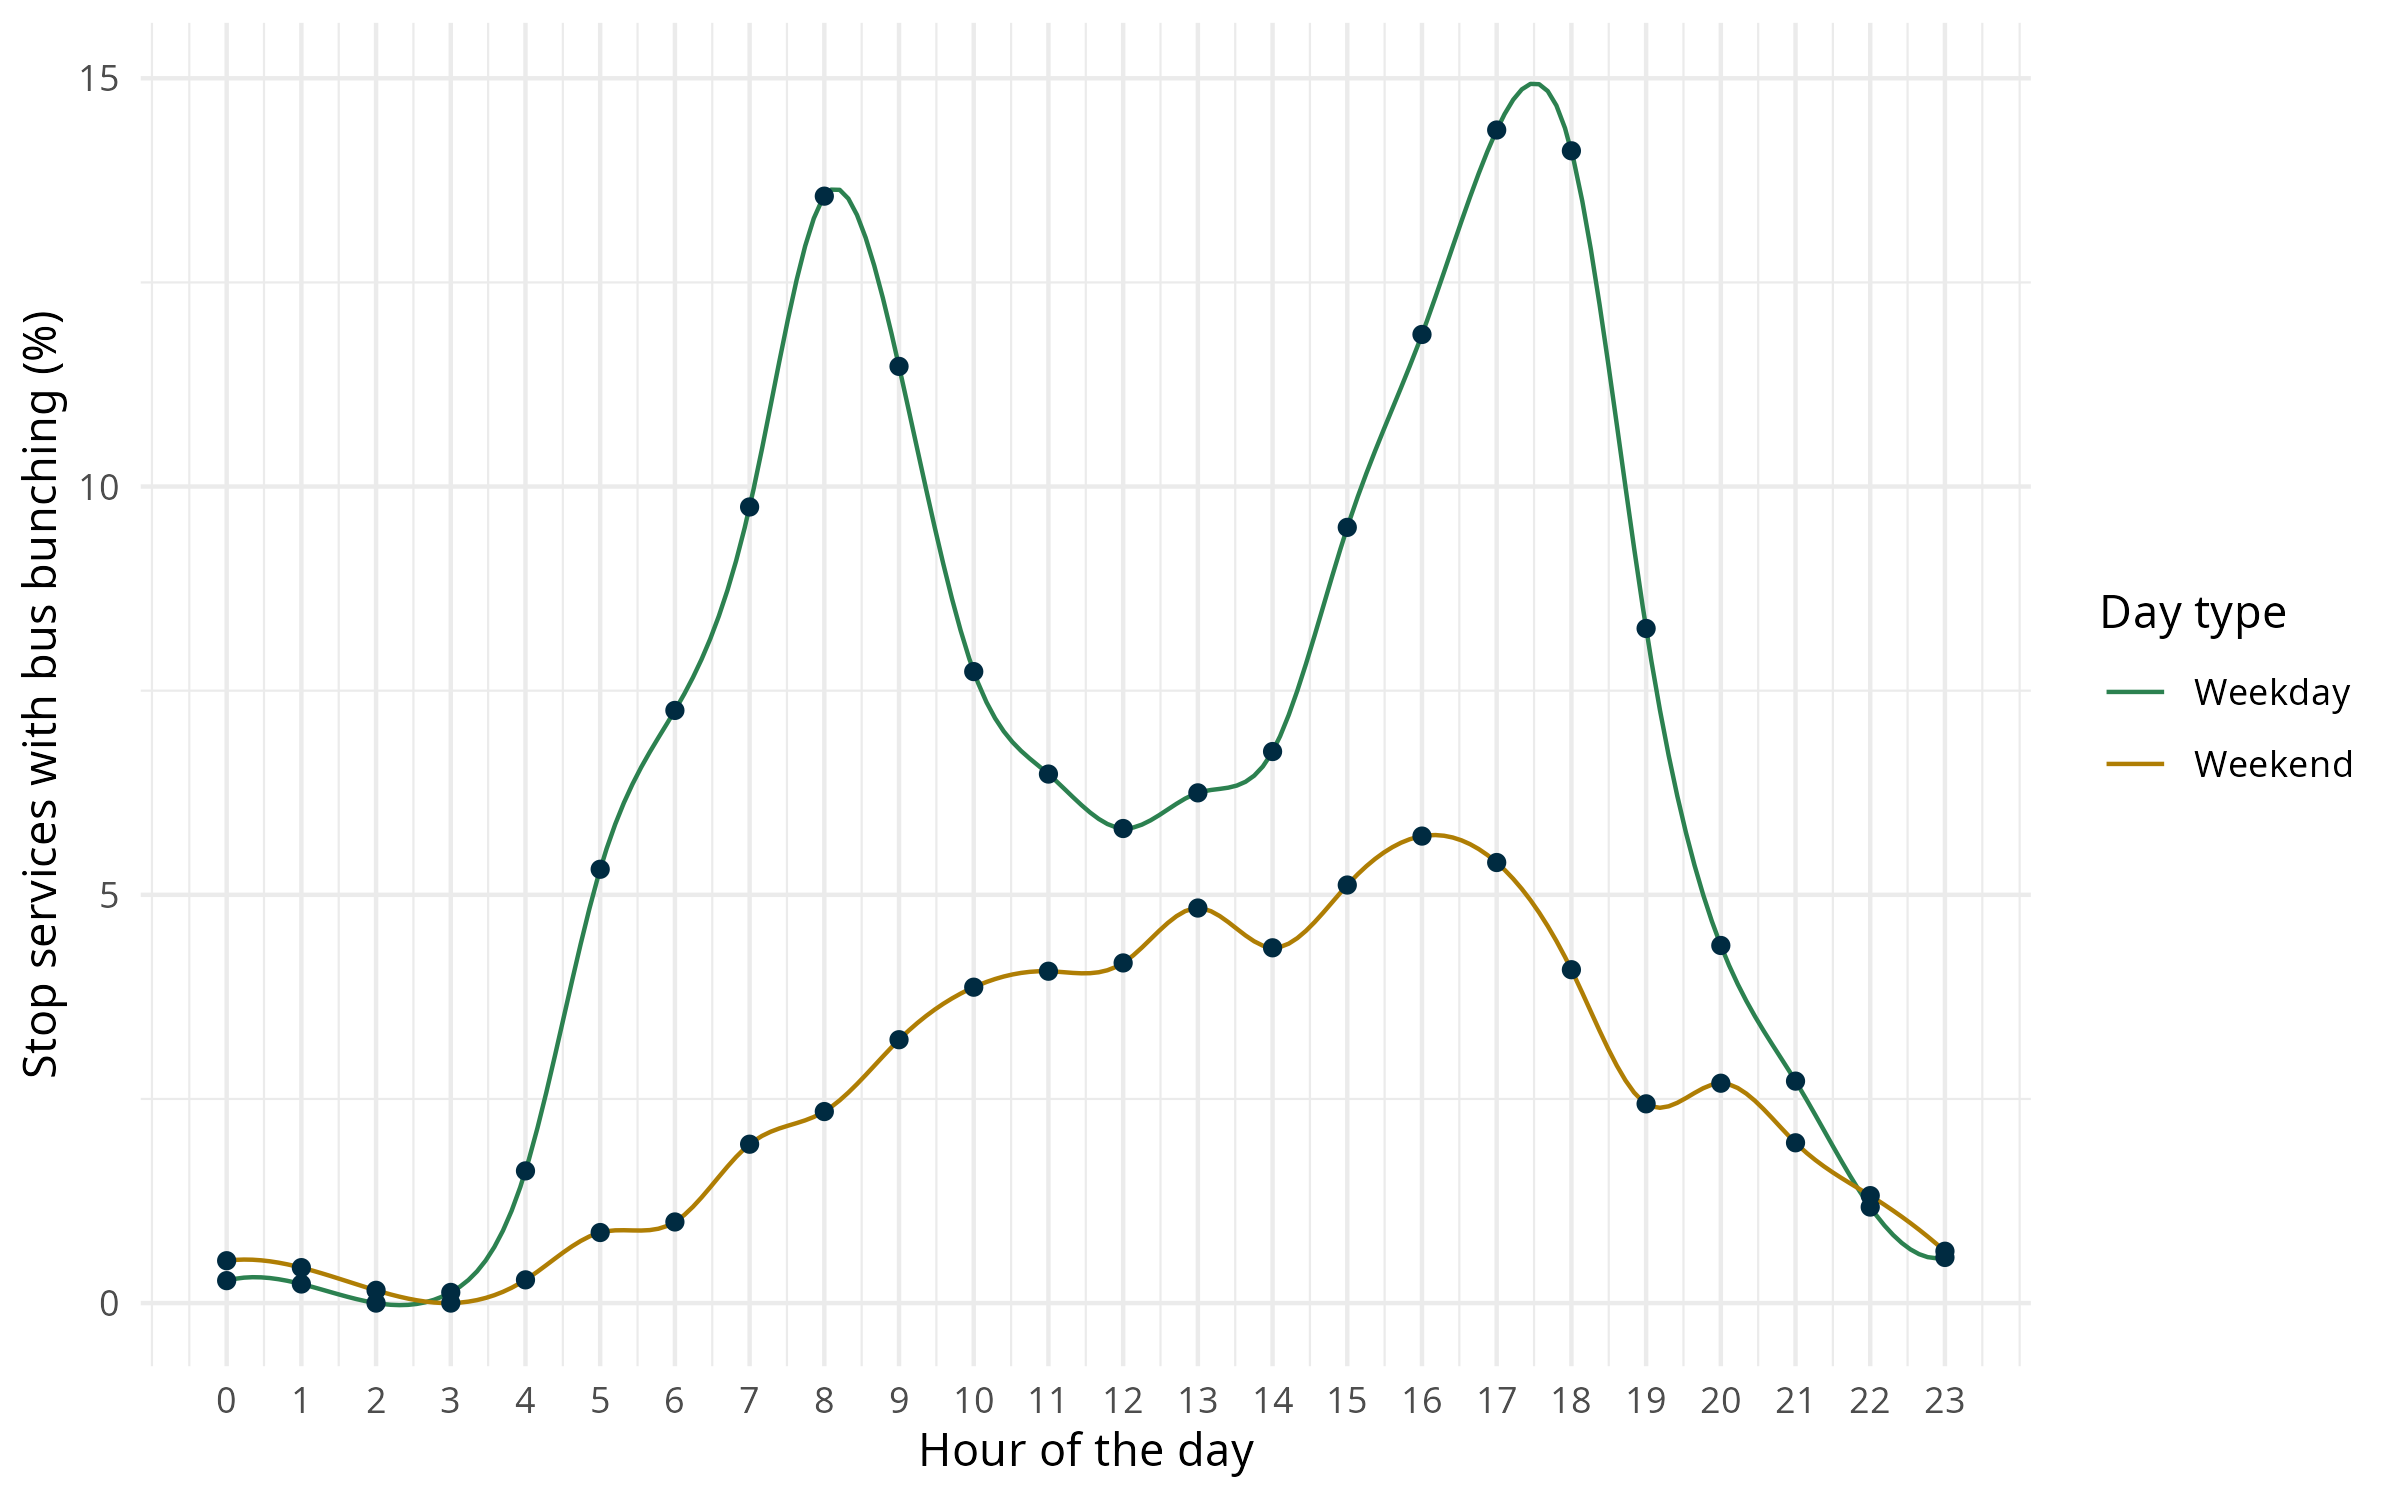
Bus bunching variation through the day
Extra
Short Turnings
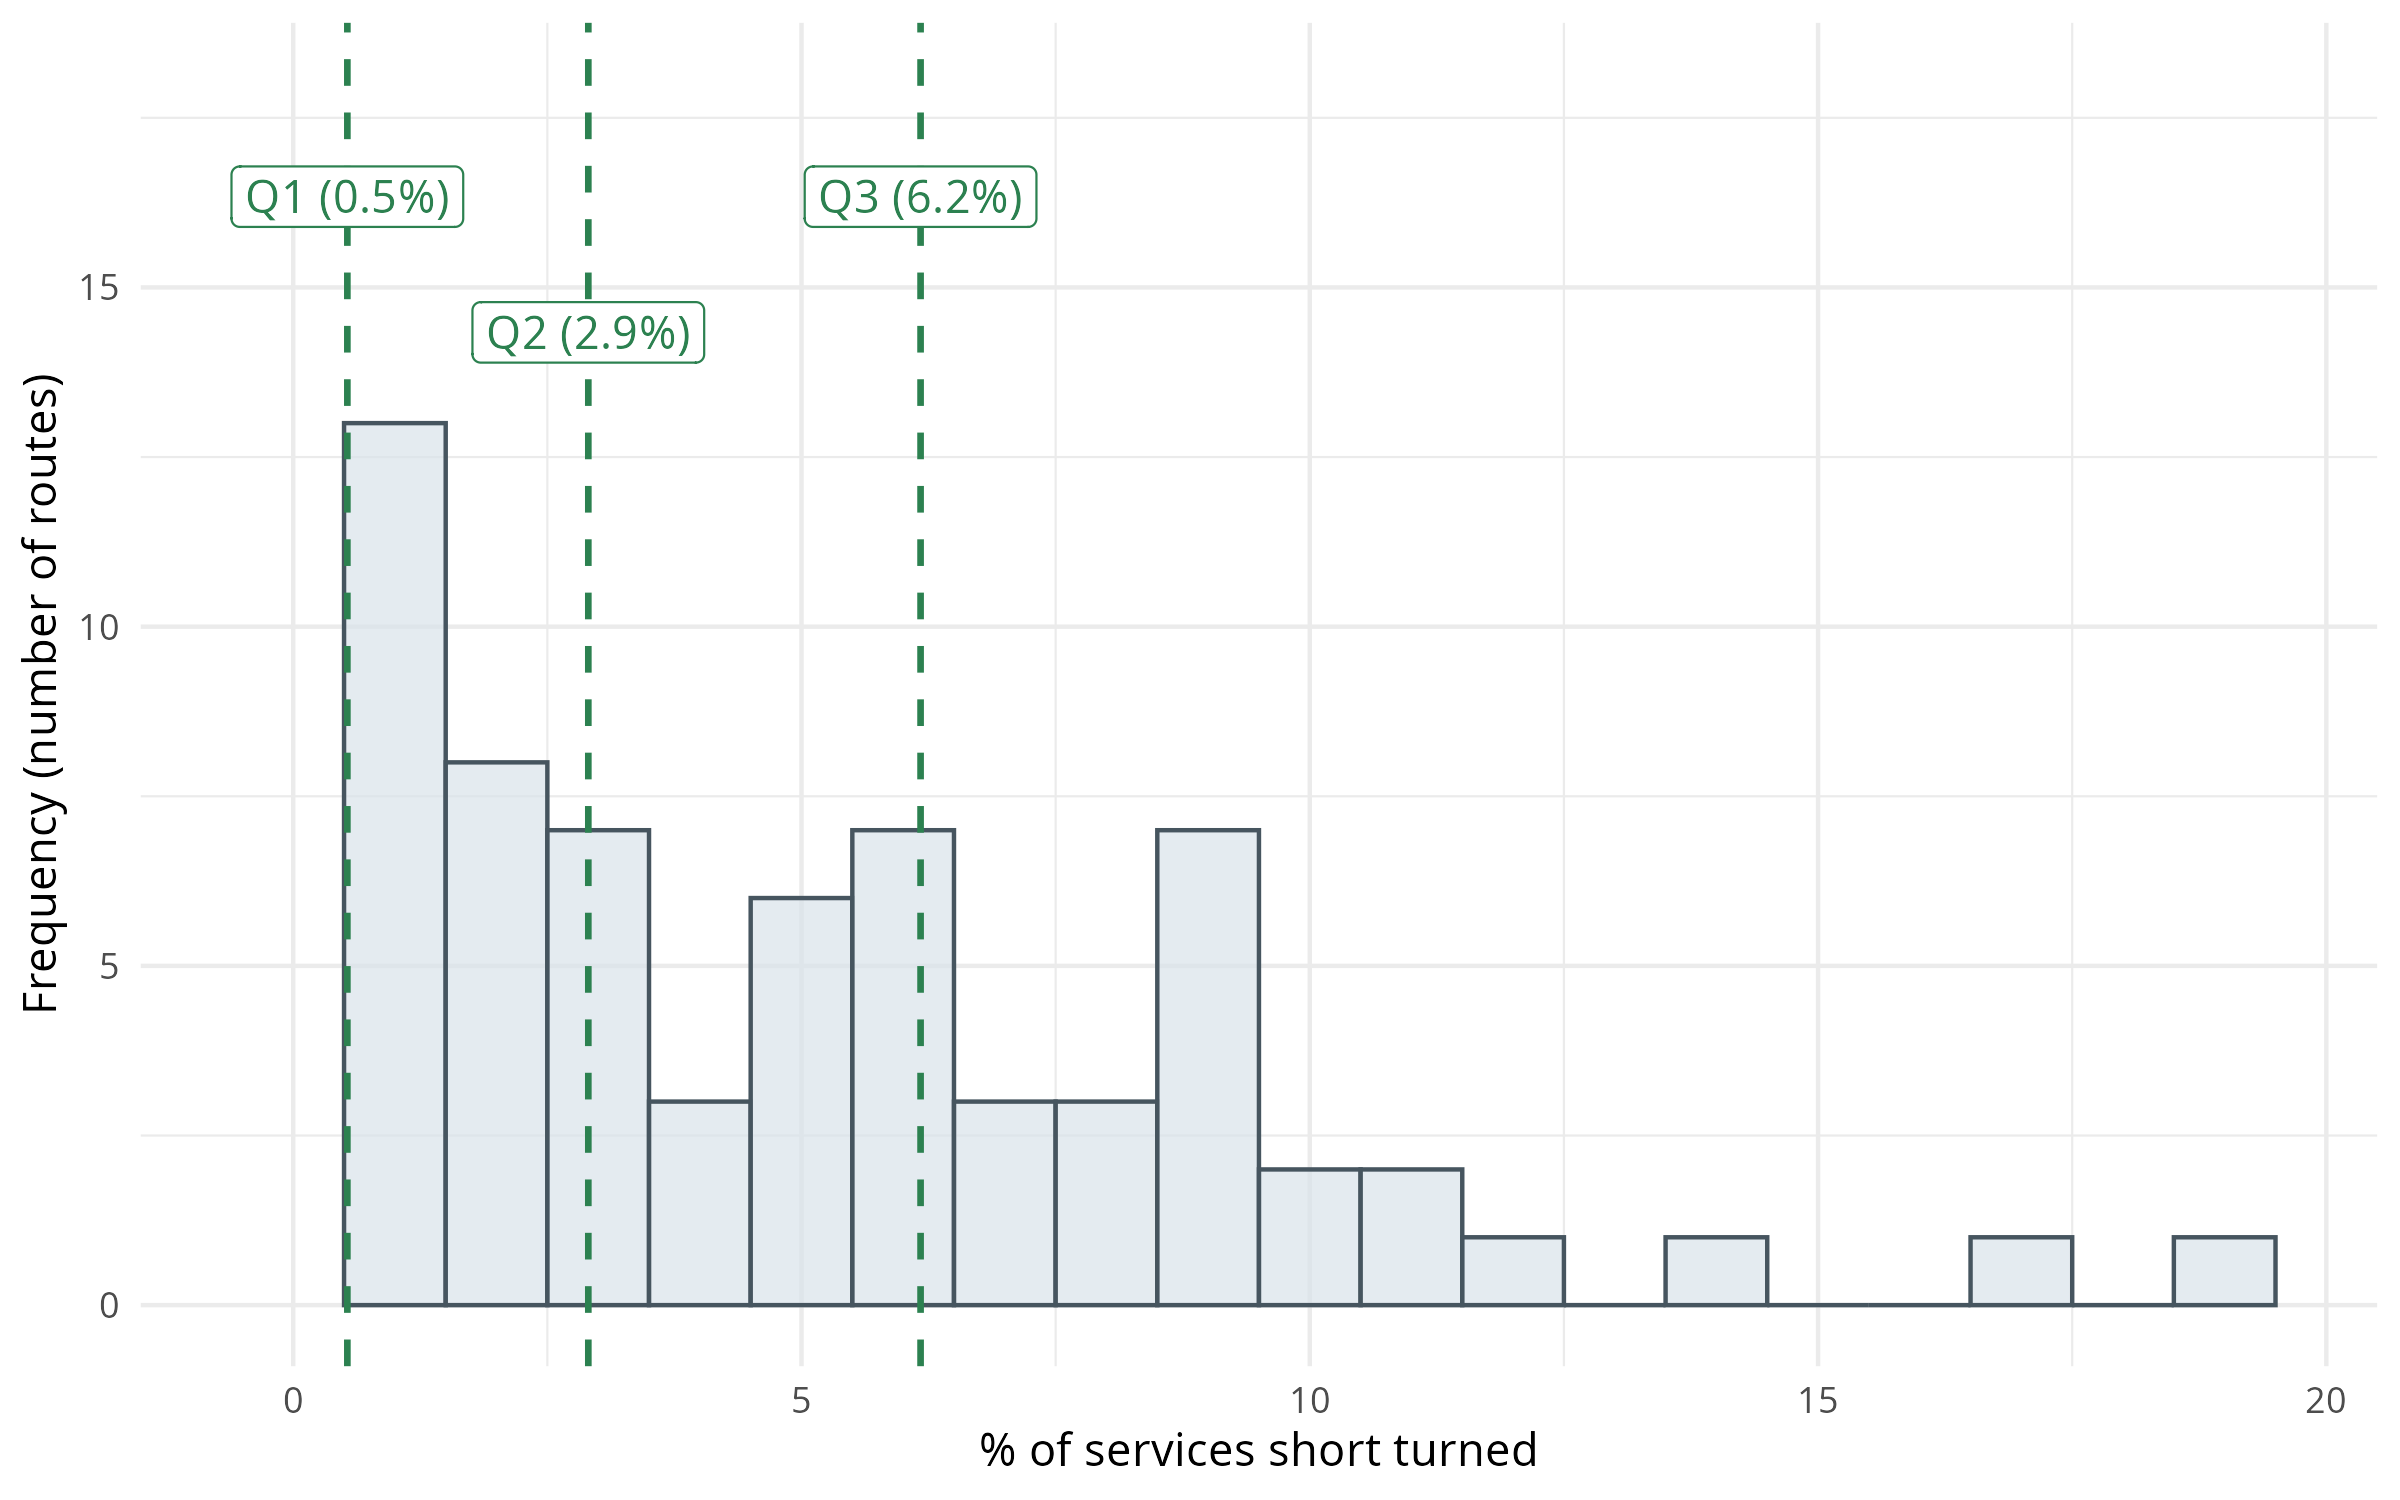
Short turnings histogram
Extra
Short Turnings
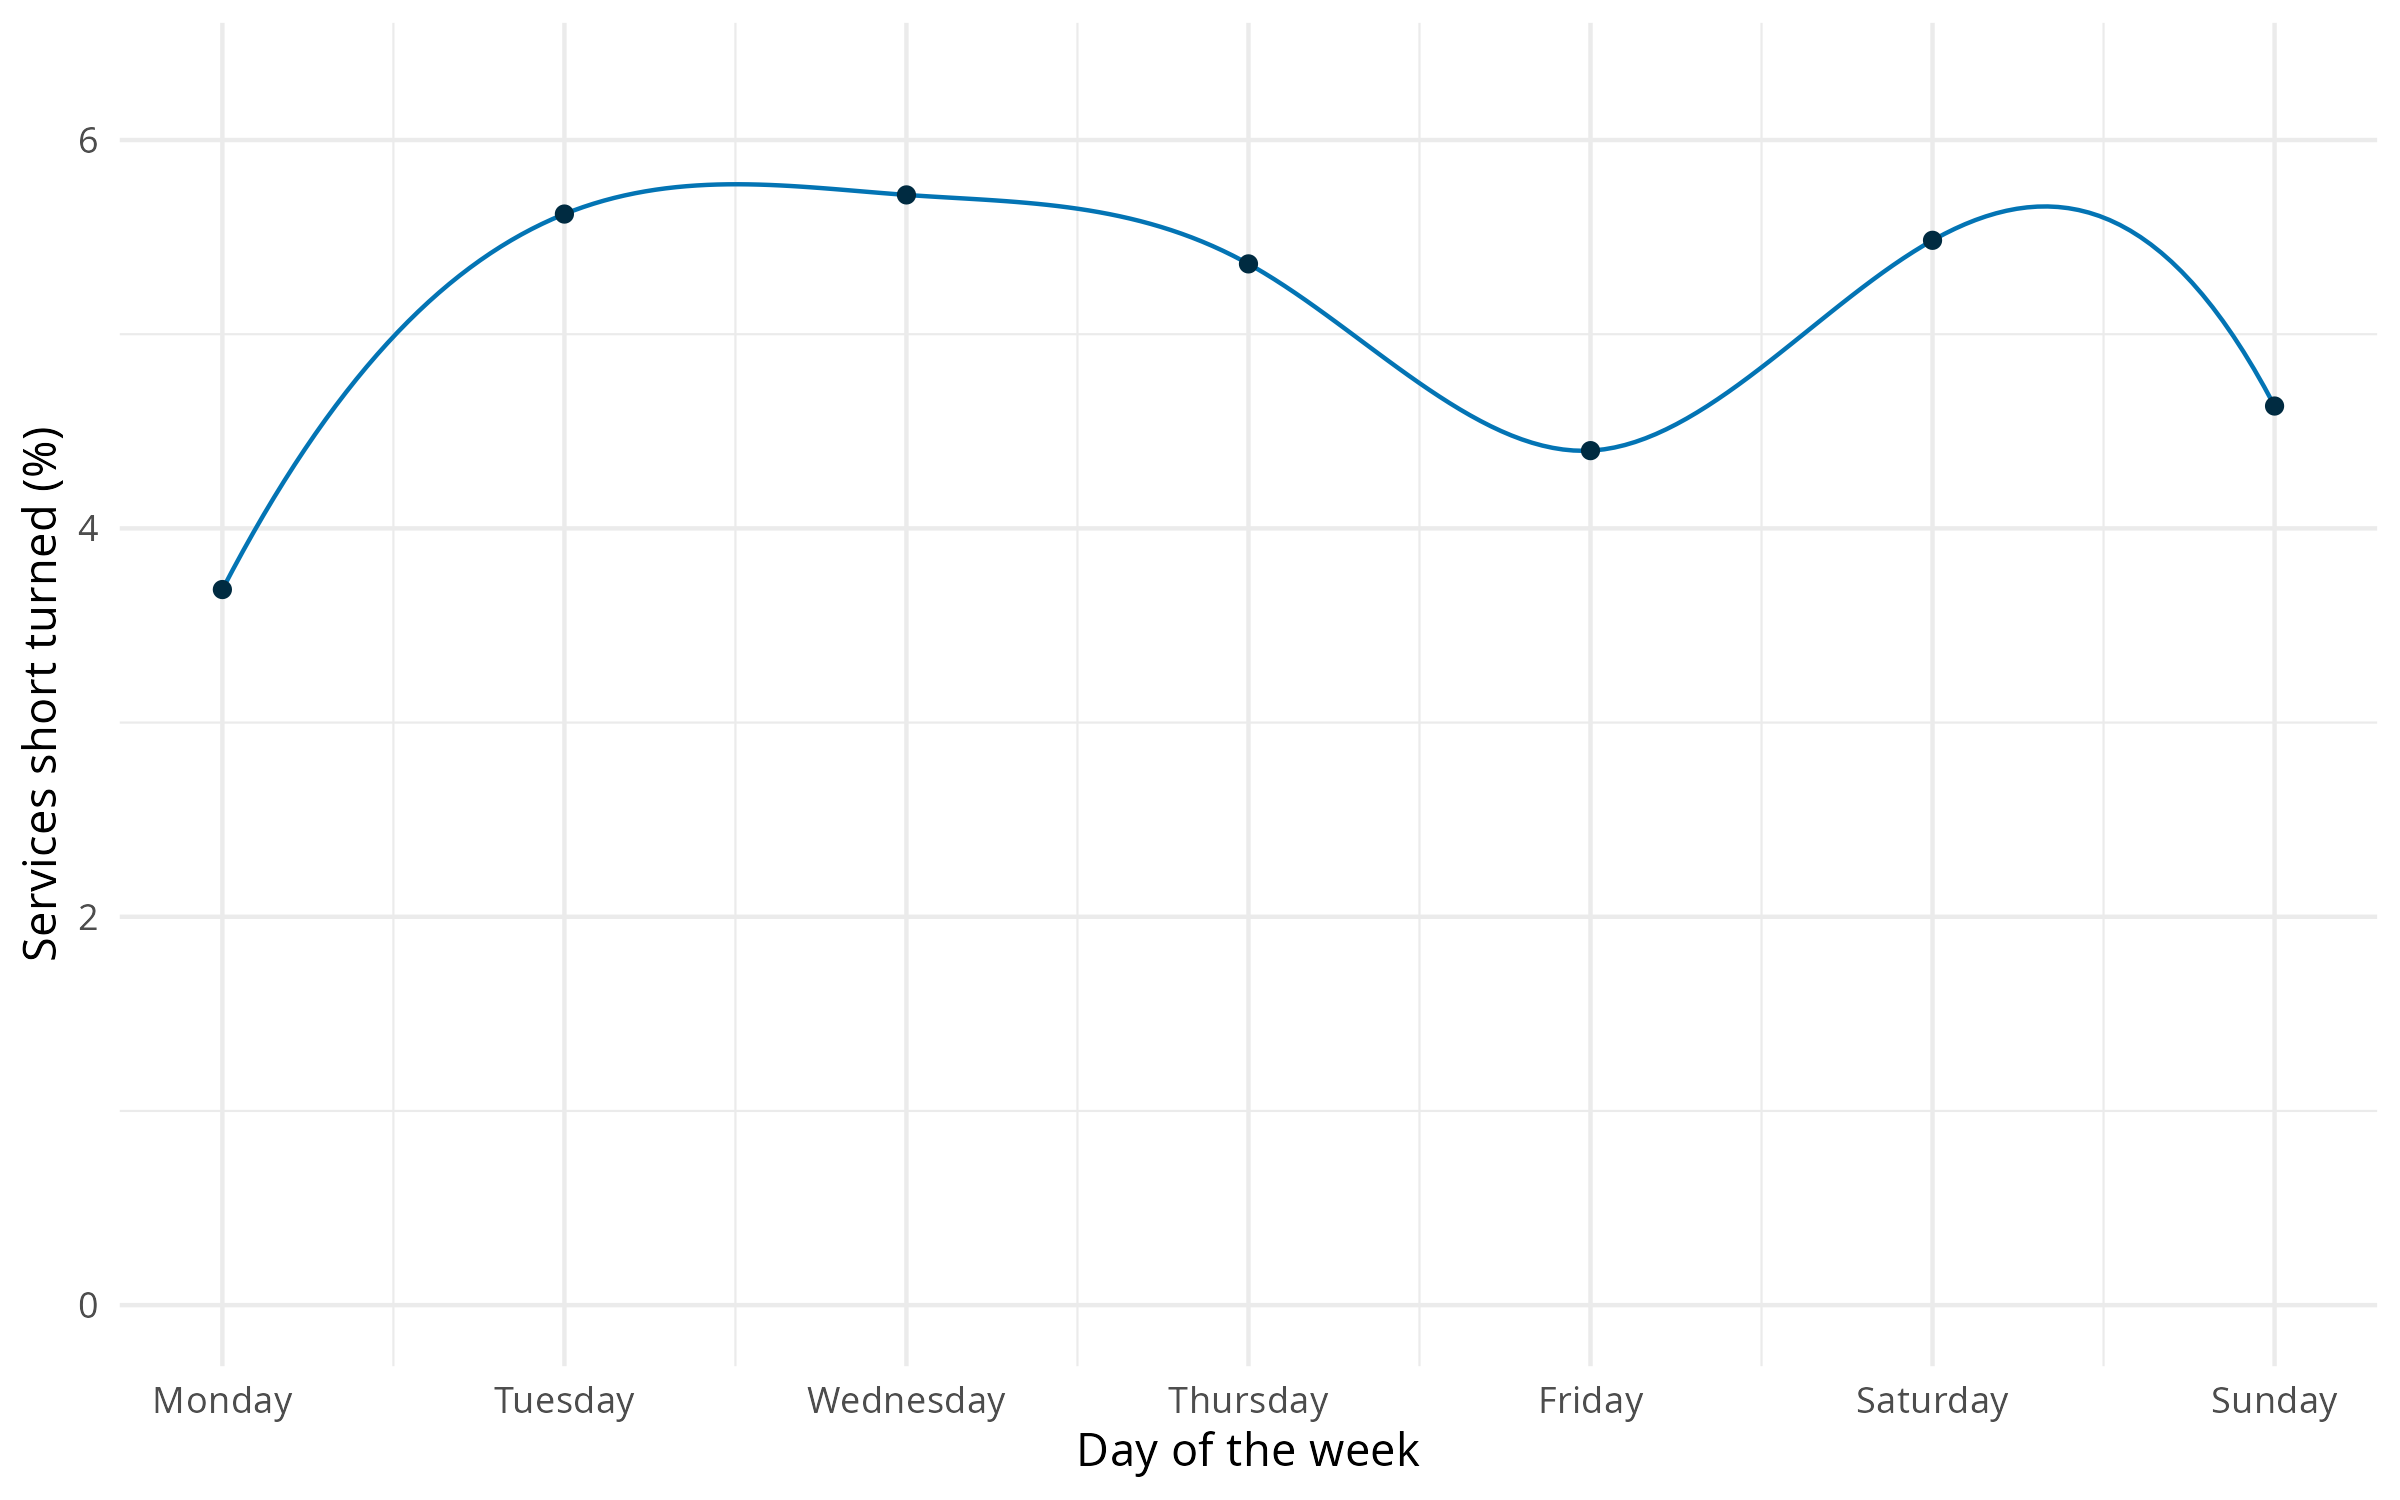
Short turnings variation through the week
Extra
Short Turnings
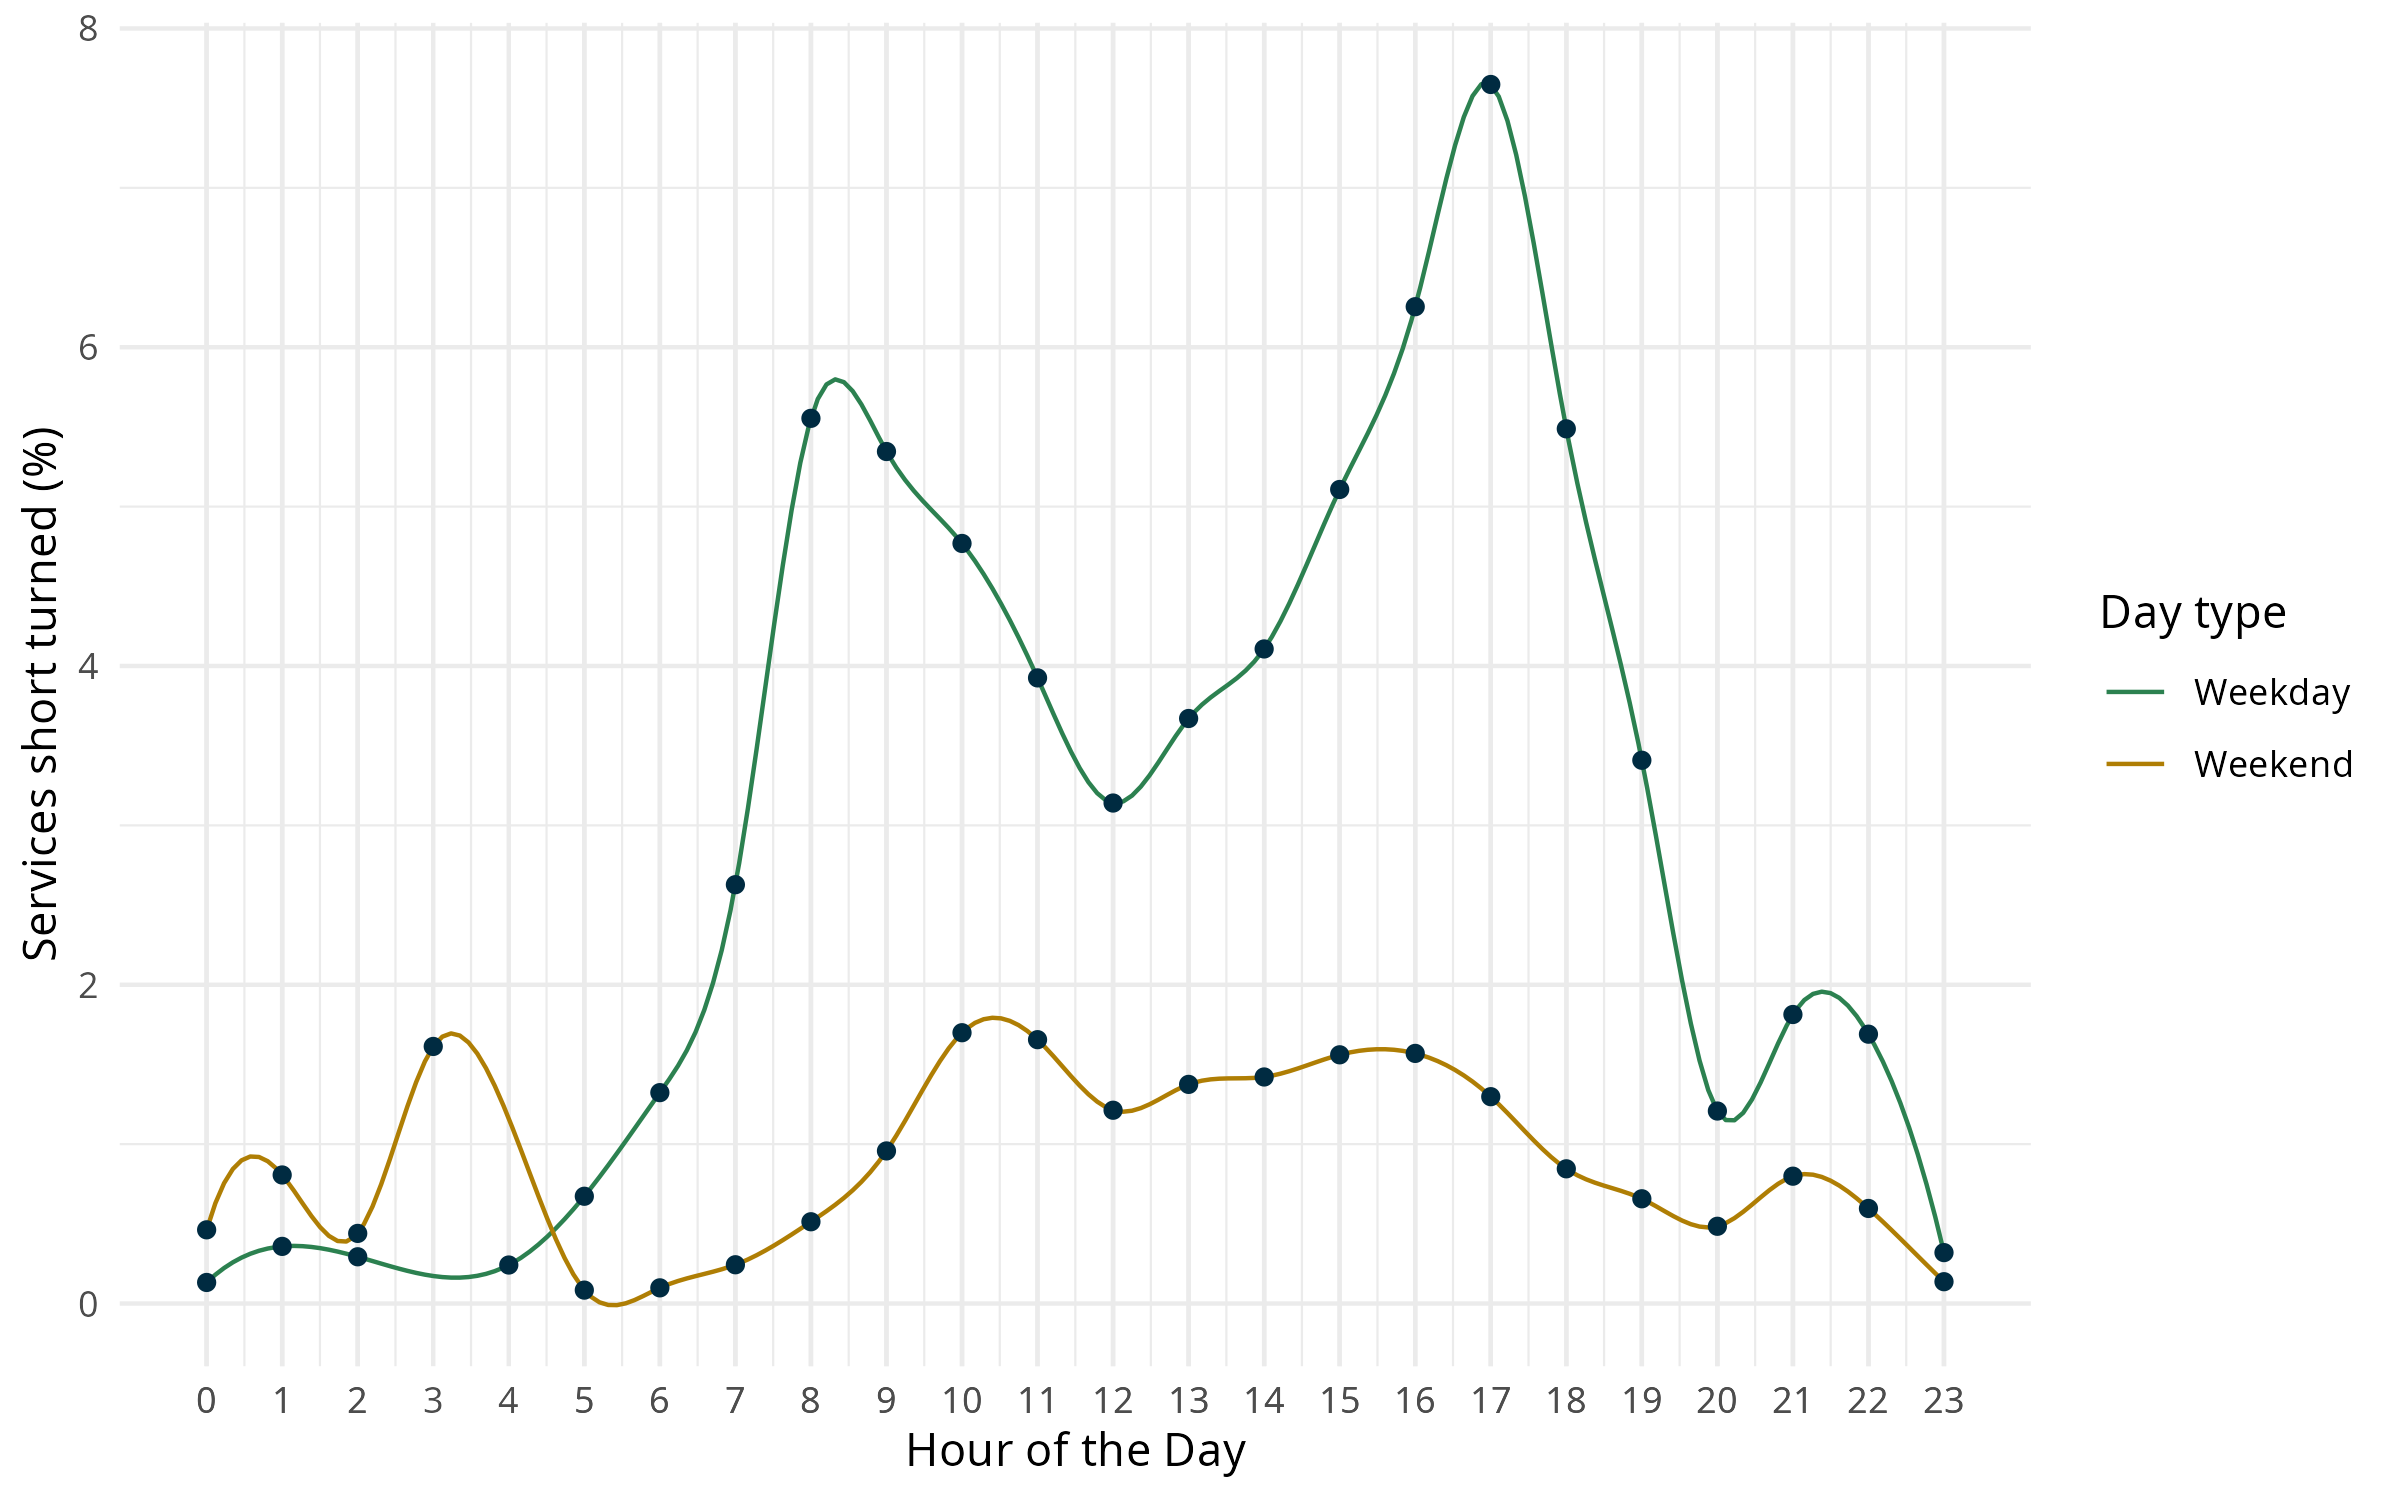
Short turnings variation through the day
Extra
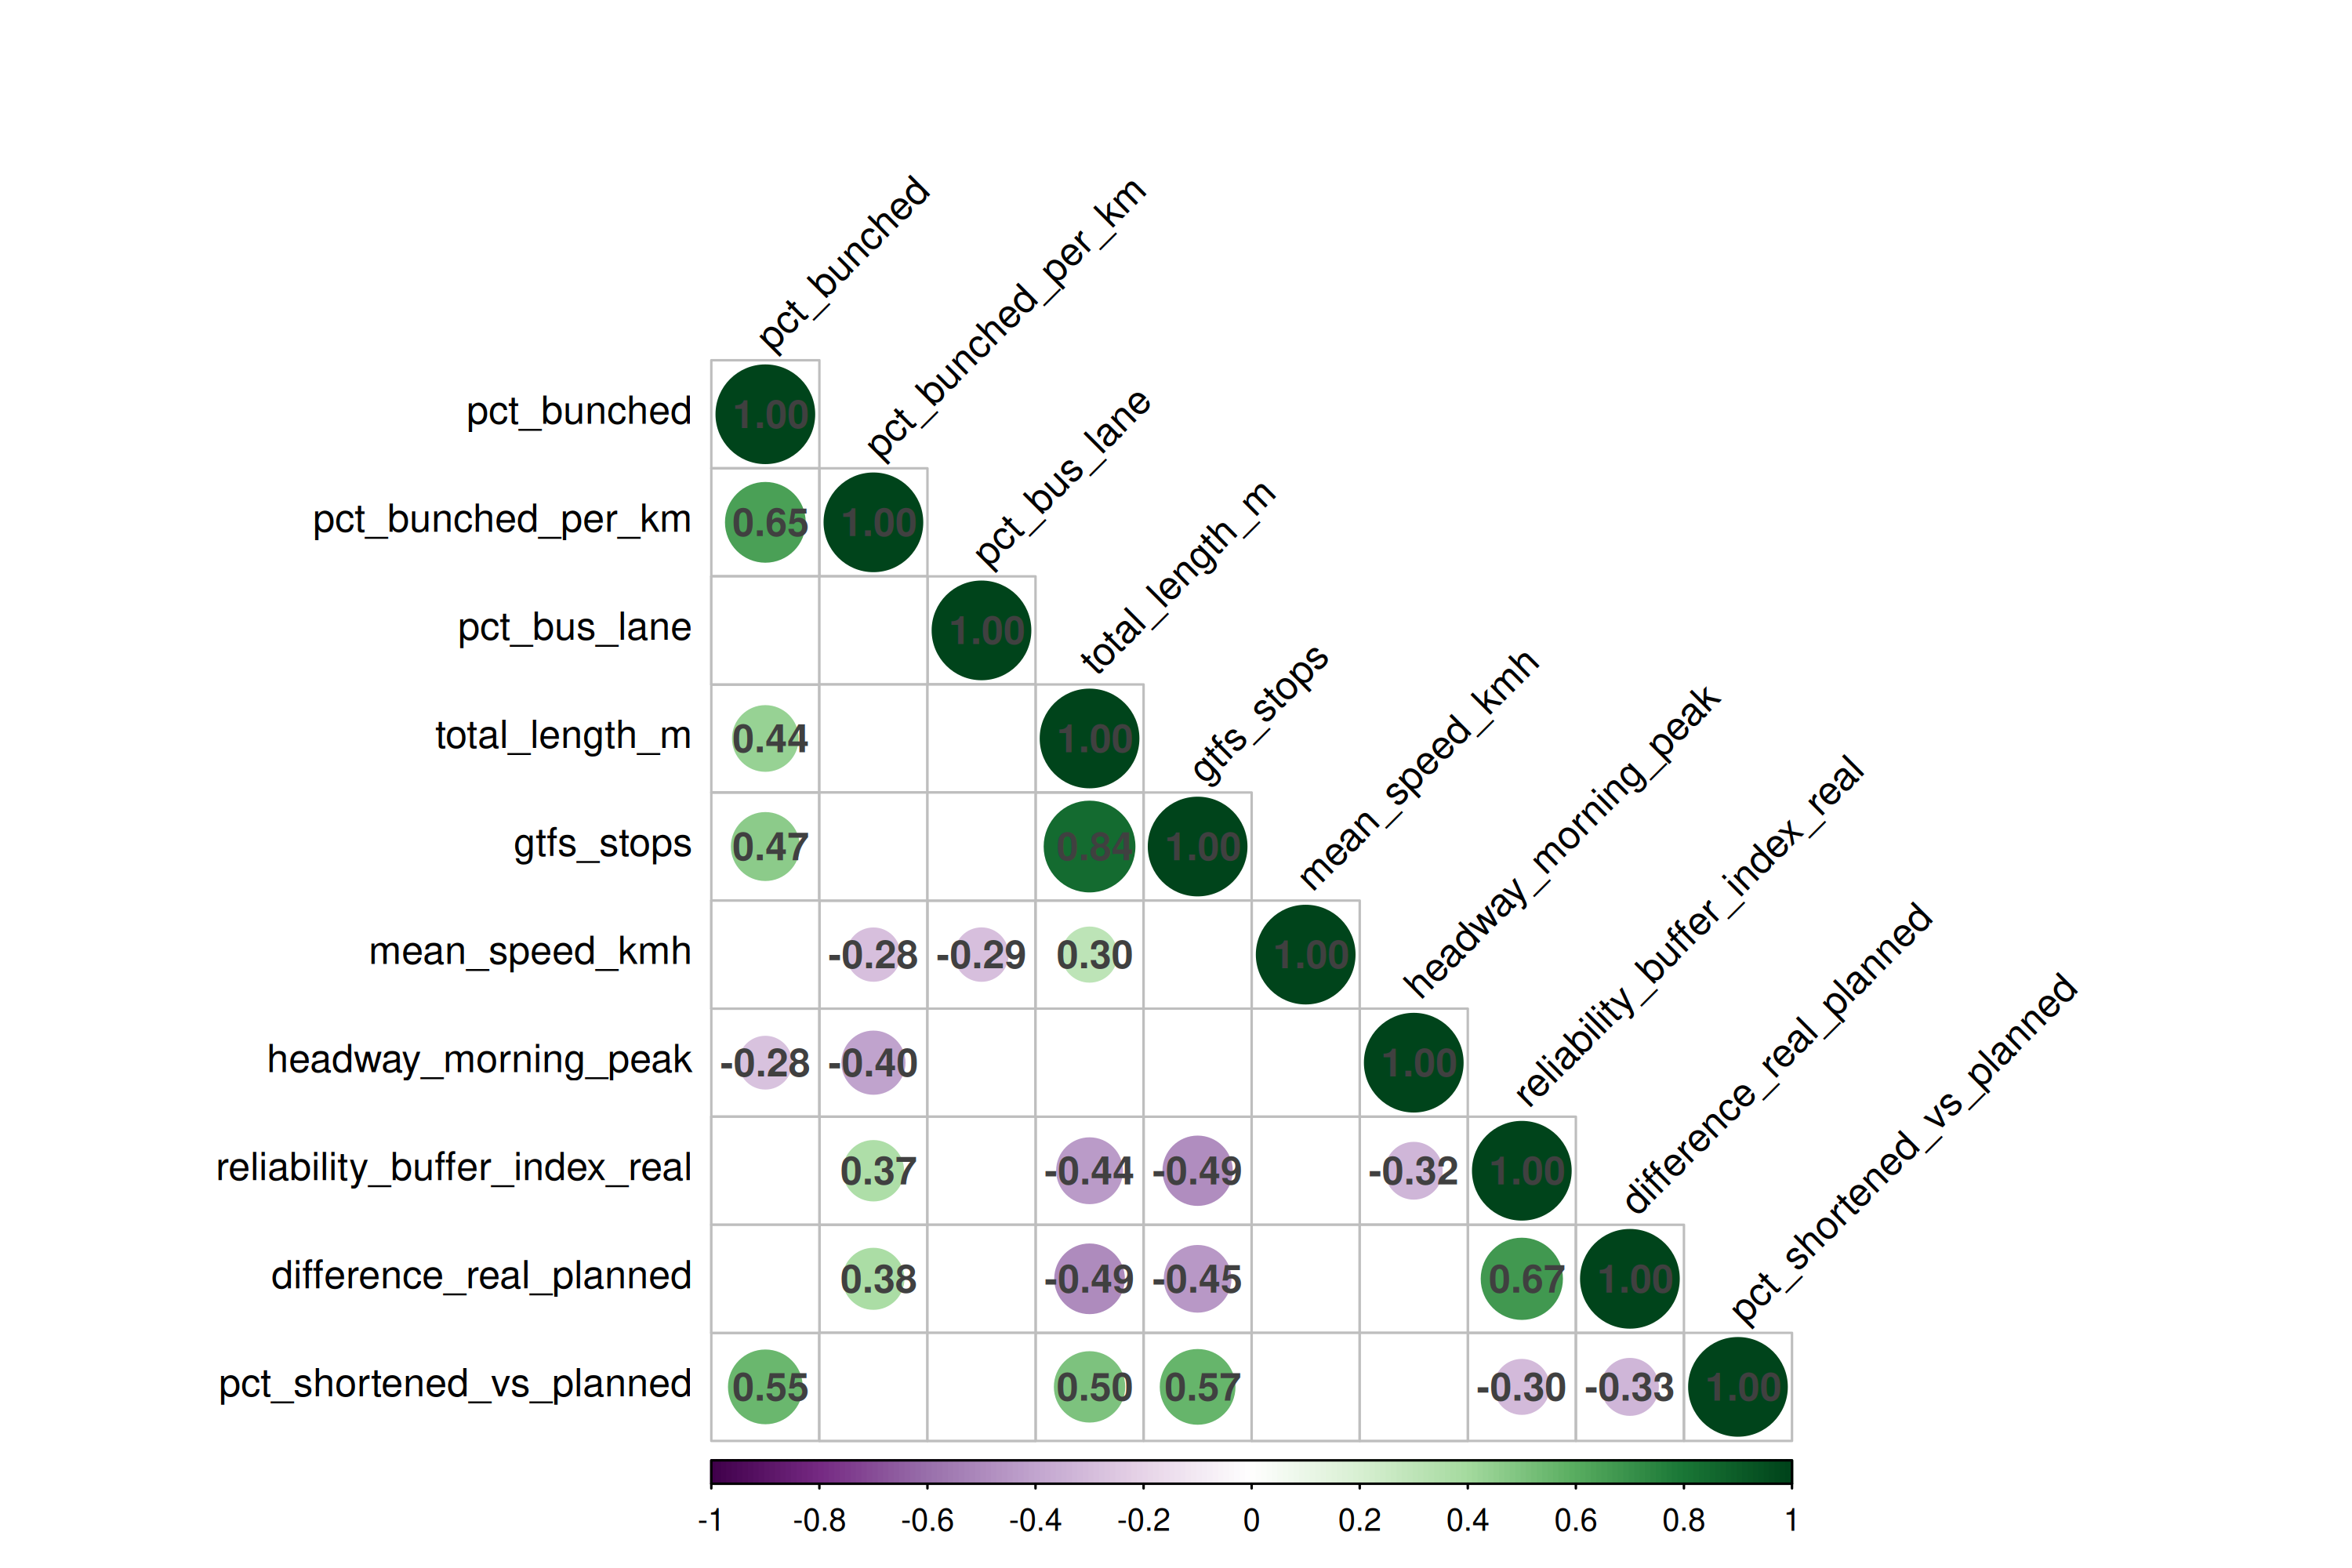
Correlations matrix (Day + Bairro)
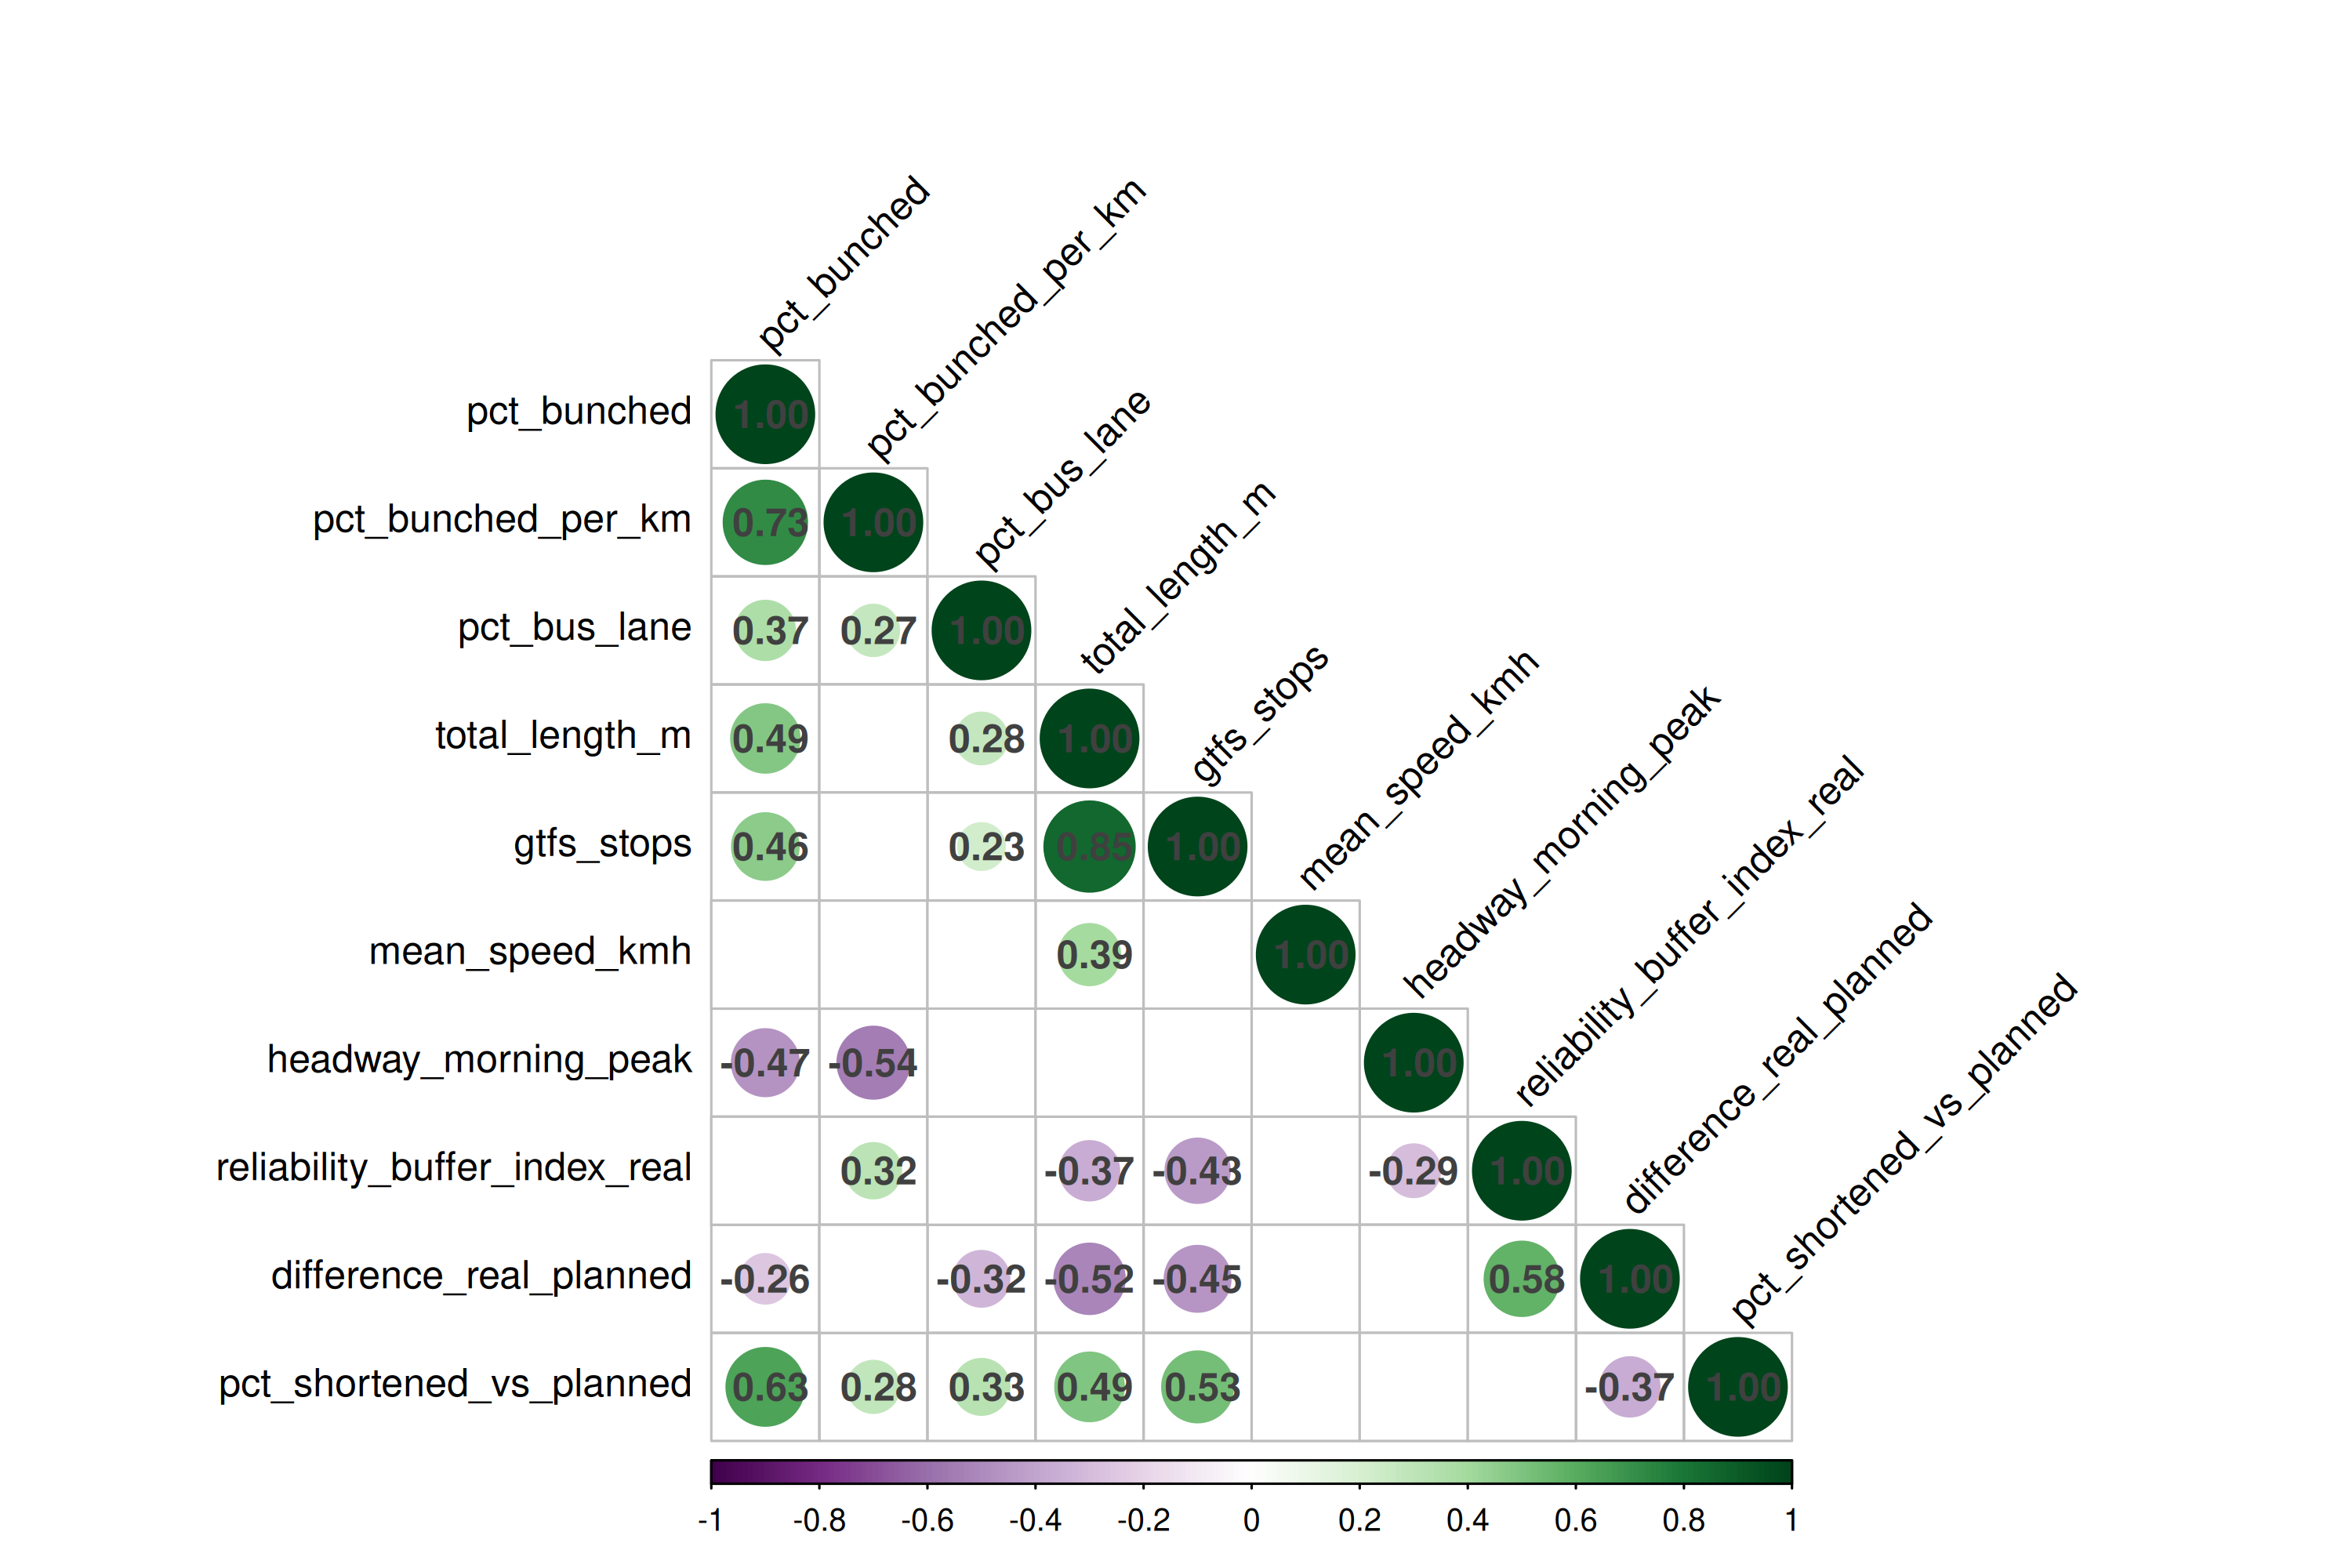
Extra
Correlations matrix (Day)
6. Conclusion
Methodological Contributions
Replicable framework to assess how tacit and explicit knowledge coexists within organizations
Code available at gmatosferreira/Through-bus-drivers-eyes
Limitations
Small interview sample, single focus group and need to standardize data
6. Conclusion
Methodological Contributions
Replicable framework to assess how tacit and explicit knowledge coexists within organizations
Code available at gmatosferreira/Through-bus-drivers-eyes
Limitations
Small interview sample, single focus group and need to standardize data
Future Work
Broaden participation to extend findings
Enhance of operating-assistance data through machine learning and decision-support tools